If technical stock analysis looks complicated to you and you are asking yourself where you should start, this is the right place to be. In this article, we will summarize John Murphy's 10 Laws of technical trading, which is very informative and every beginner on the stock market should read it.
The most important rules of technical trading are:
1. Determine Long-Term Perspective of the Market

By studying long-term monthly and weekly charts, spanning over several years, will provide you more general overview of the direction where the markets are going. Do not start and limit your research to analyzing short-term charts only, even if you are trading shorter periods.
2. Determine the Trend You Trade

As you read in Stock Market Trend article, trend comes in many sizes: long-term, intermediate-term and short-term. What you should do is to focus on the trend you trade and make sure to trade in its direction. In the uptrend, you should buy dips and sell rallies. Shorter chart periods are use for timing, while long-term charts research will help you determine the trend.
3. Determine Low and High of the Trend You Trade

Look at the chart and determine support and resistance levels as explained in Support and Resistance article. Buying should occur near support levels and selling near resistance levels. Once the resistance (support) is broken, it will usually provide support (resistance) to future pullbacks. Determining support and resistance levels form basis of technical stock analysis.
4. Watch the Retracements

Markets usually correct significant portion of previous trend. The retracement can be minimally one-third, half or maximally two thirds of the prior trend. Help yourself with Fibonacci levels. Retracement levels should be marked as buying points. We have written a detailed article about how retracement levels of technical stock analysis can be useful in forming successful trading strategy.
5. Draw the Trend Lines

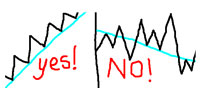
Simple trend lines are one of the most effective charting tools. Connect two successive lows to get up trend line or two successive tops to get down trend line. Stock prices often pull back to trend lines before they continue in the direction of the trend. The more times the trend line is touched and not broken, the more important it is. Once broken, it signals a change in the trend.
6. Moving Averages Crossovers Confirm Changes

Moving averages tell you if the trend is still in motion, however, they provide a confirmation of trend change, they do not tell you anything in advance. Two moving averages crossovers can provide you objective buy and sell signals. Traders often use 4/9, 9/18 and 5/20 crossovers, the crossing of 40-day MA also provides good signals. Since moving averages are trend following indicators, they provide best results in trending markets.
7. Use Oscillators to Detect the Turns

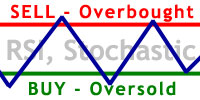
Oscillators are helpful when determining overbought and oversold situations. They are popular indicators since they warn you of possible trend change in advance. Most often used oscillators are RSI and Stochastic, both plotted on a scale of 0 to 100. Crossing the 70 (80) RSI (Stochastic) reading signals overbought conditions and 30 (20) RSI (Stochastic) signals oversold conditions. Oscillators perform best in trading market range, when there is an absence of market trend.
8. MACD Warns You of Trend Changes

MACD (Moving Average Convergence Divergence) indicator combines moving averages with overbought/oversold conditions of oscillators. You should buy (sell) when faster line crosses above (bellow) the slower line and both are bellow (above) zero. If you plot a MACD histogram on your chart, you can get even earlier warnings of possible changes in the trend.
9. Trading or Trending?

ADX (Average Directional Movement Index) measures the degree of market trend and tells you, which set of indicators are best to follow. A raising ADX signals a strong trend, while a falling ADX signals no-trend or trading conditions. When ADX is raising, you should favor moving averages, when it is falling, you should favor oscillators.
10. Volume and Open Interest Confirmation

Volume is often preceding the price change. Heavier volume is confirming up trend on up days and vice versa. Another important factor to watch is open interest in the futures market. Raising open interest (fresh money coming in) is supporting uptrend, while declining open interest is a warning of trend completion.
You can find the original article "Murphy's ten laws of technical trading" on Stockcharts.com website.
Written by: Goran Dolenc
Do you find this content useful? Like! Tweet! Recommend! Share!
Where To Go Next?
Stock Market Technical Analysis for Traders and Investors
Stock market technical analysis is the charting method of analyzing securities. Price and volume are strictly driven by demand and supply, also forming the future trend.
Use Of Stock Market Trend In Technical Analysis
Identifying stock market trend is one of the most important steps of technical analysis and then acting in the direction of the trend rather than going against it.
Support And Resistance Trading Importance
Support and resistance trading is important concept of technical analysis, describing the battle between bulls and bears at price levels that are difficult to cross.
Abnormal Trading Volume Analysis
It is not only the price of a stock that attracts technical analyst's attention, abnormal trading volume is also extremely important part of stock market research.
Technical Analysis Charts
Although technical analysis charts are very simple to use, there are some things to be careful about when interpreting the story the chart is telling to you.
Types Of Stock Market Charts - Comparison Of Line, Bar And Candlestick Charts
Different types of stock market charts are used in technical analysis. Most widely used are line, bar and candlestick charts.
Point and Figure Charts Explanation
Point and figure charts are useful technical analysis tool used by advanced investors to help them determine buy and sell signals.
Stock Chart Patterns Tutorial
Stock chart patterns are formations of stock price movements which are used by technical analysts to indentify probable future price trends mostly over long-term timeframes.
Trading Moving Averages Guide
Trading moving averages help traders and investors to identify trend, trend reversal and support/resistance levels by reducing the noise out of the stock price movement.
Stock market indicators and oscillators
Stock market indicators provide useful additional information about stock market trend, momentum, volatility and other aspects of technical analysis.
Back from Technical Stock Analysis to Investing in Stock Market
Back from Technical Stock Analysis to Best Online Trading Site for Beginners home page


