Trading Moving Averages Guide
Trading moving averages help traders and investors to identify trend, trend reversal and support/resistance levels by reducing the noise out of the stock price movement.
The idea of trading moving averages (MA) was born because of a lot of noise in stock price movement, which sometimes makes it difficult for traders and investors to define the overall trend. The purpose of trading moving averages is to eliminate this noise by plotting the stock's average price for the last x periods over user's defined timeframe, thus smoothing the price movement by eliminating recent fluctuations. In this manner chartist increase the probability of their trading moves.
Different Types of Moving Averages
There are three main types of trading moving averages: simple, linear and exponential. They differ in the calculation method; while some of them weight historical price data equally, others treat recent stock price as more important. However, regardless of the type of MA, the interpretation of trading moving averages stays the same with all of them.
SMA - Simple Moving Average
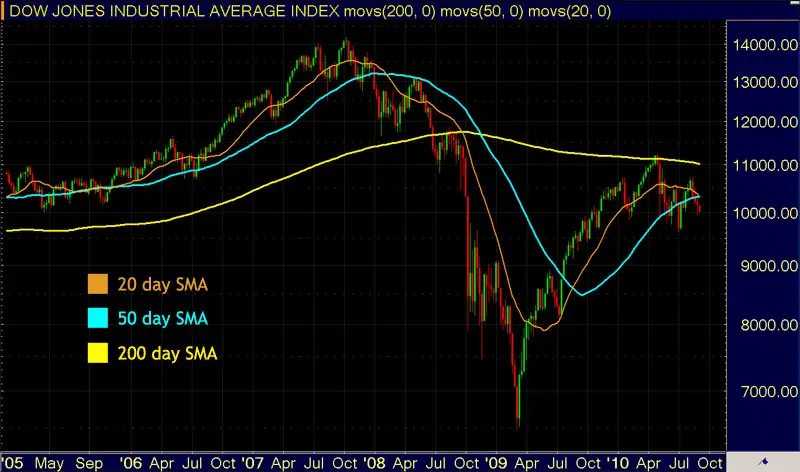
Simple moving average is the most often used type of moving averages. Its calculation is very simple. A 20 day SMA is calculated by averaging the closing price of the last 20 trading days for example. The main characteristic of SMA is, that every historical price has the same weight in the averaging calculation or if I put it in another way, when calculating 20 days SMA, today's closing price is equally important to the closing price 20 days ago.
Most technical analysts are trading the following moving averages: 200 days SMA as long-term trend indicator (measure of a trading year), 50 days SMA as medium-term trend indicator (measure of a quarter - remember, companies report earnings results every quarter) and 8 or 20 day SMA as short-term trend indicator (measure of a week or month). Of course, if your trading timeframe is shorter as for example for scalpers or day traders, you can use the same moving averages, the only difference is, that they should be calculated over closing prices of shorter periods (for example 8 SMA of the closing prices for the last eight five minutes periods).

Some individuals criticize the SMA with the arguments that resent stock price data is more important than older ones and should therefore have a higher weighting in the calculation. This is how other types of trading moving averages were invented.
Linear Weighted Average
This type of moving average is rarely used by chartist. It is calculated in the following way: you weight the closing price of the most recent period by multiplying it with the number of periods in calculation; you weight the closing price of the recent -1 period by multiplying it with the number of periods in calculation -1; and so on. This numbers as summed at the end and divided by sum of multipliers.
An example of 5 day linear weighted average calculation:
=(Last close x 5 + Close (-1) x 4 + Close (-2) x 3 + Close (-3) x 2 + Close (-4) x 1) / (5 + 4 + 3 + 2 + 1)
EMA - Exponential Moving Average
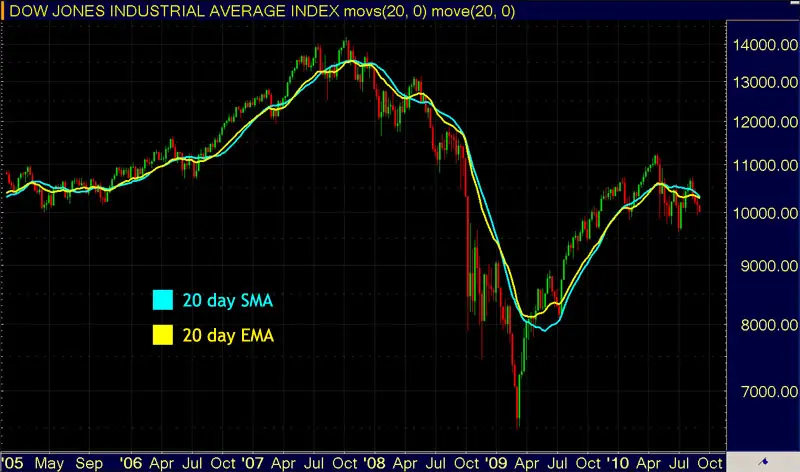
This type of trading moving averages is much more often used the linear weighted, since it is considered to be more efficient because of the smoothing factor used in the weighting. You shouldn't bother too much with the calculation method, since all the charting software is taking care about it and you just simply plot it on the chart. The latest price data is playing a much more important role in the calculation then older data and this is the most important fact to remember and the major difference to trading simple moving averages.

How You Should Be Trading Moving Averages?
There are many different uses of moving averages. A trader or investor can use MA to help them identify trend, trend reversal and support/resistance levels.
MA and Trend
Trend is very easy to identify with moving average. If the MA is sloping upwards and the price is above it, you have an uptrend. If the MA is sloping downwards and the price is below it, you have a downtrend.
Trend can also be identified by plotting tow or even three MA on the chart, each representing different period calculation. If short-term MA is above the medium and long-term MA, it is signaling an uptrend and vice versa.
MA and Trend Reversal
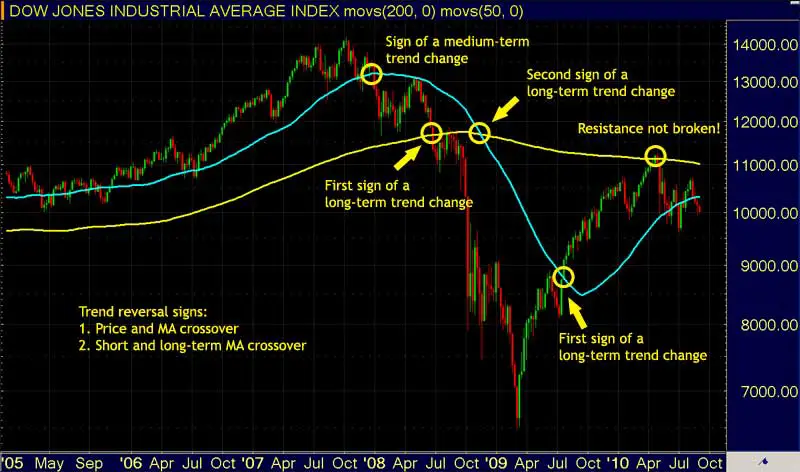
The first sign of possible trend reversal appears, when the price crosses the moving average. Like already written, the most important moving averages are 8, 20, 50 and 200 days moving averages.

Another signal of trend reversal appears when short-term moving average crosses longer-term moving average upward or downward. This signal comes later then the first sign of possible trend reversal, but it is treated as more reliable. If you are analyzing long-term trends, you should use 200 and 50 days MA crossover signals for trend reversal, while short-term traders should use 8 or 20 and 50 day MA crossovers.
MA and Support/Resistance
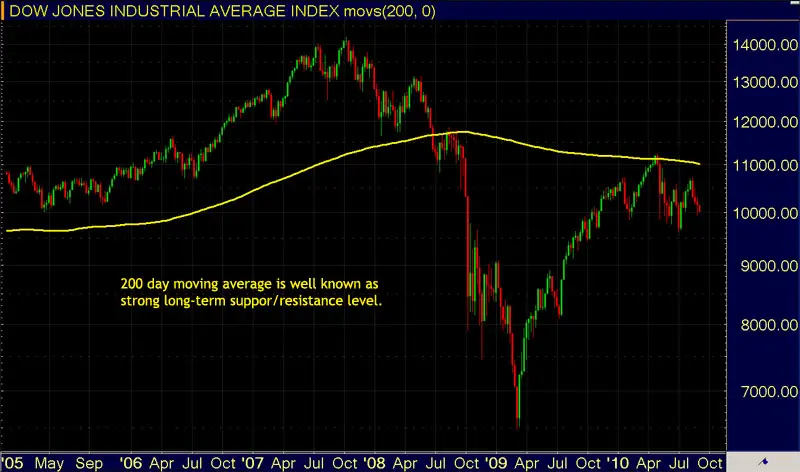
Moving averages also present an important support/resistance levels. The longer the moving average, the more important support/resistance level it is.

For example, a 200 day moving average represents a much stronger support or resistance level than an 8 day moving average. The first is rarely broken, while the latest quite often.
Recommended Reading - Recommended Reading - Recommended Reading - Recommended Reading
Back To Technical Stock Analysis Index...
Next step: Stock market indicators and oscillators...
Written by: Goran Dolenc
Do you find this content useful? Like! Tweet! Recommend! Share!
Back from Trading Moving Averages to Investing in Stock Market
Back from Trading Moving Averages to Best Online Trading Site for Beginners home page


