Stock Chart Patterns Tutorial
Stock chart patterns are formations of stock price movements which are used by technical analysts to indentify probable future price trends mostly over long-term timeframes.
Stock price movement is forming different kinds of stock chart patterns, which are indicating possible future price trends and reversals of the stock and generating high probable buy and sell trading signals based on them. The theory behind chart patterns is based on the history repeating itself and technical analysis chartists try to convert this assumption in trading opportunities.
Even if there is a lot of knowledge behind analyzing stock chart patterns, you should remember that none of the patterns is 100% certain in its prognosis of future price movement. Another problem is that every eyes see different story out of the charts and thus making technical analysis a more subjective than scientific topic. Because of these facts it is very important that your trading, if based on analyzing stock chart patterns, is combined with efficient risk and money management.
There are two kinds of chart patterns, continuation and reversal. Continuation patterns signals that the current stock price trend will continue in the same direction after the pattern is complete, while reversal patterns suggest trend change after completion. You can find some basic information about the most popular chart patterns further in this article.
Reversal Chart Patterns
Head and Shoulders
Head and shoulders is one of the most reliable reversal chart patterns. Two types of this pattern can arise: at the top, which is signaling the end of an uptrend and at the bottom, which is signaling the end of a downtrend - the latest is also known as inverse head and shoulders pattern.
You should be able to spot on the chart two shoulders (left and right), a head, whose high is higher than shoulder highs in case of the top head and shoulder pattern or its low is lower than shoulder lows in case of inverse pattern, and a neckline, which is representing a support or resistance level of the pattern. Once that the pattern is completed and neckline broken, you can expect a trend reversal with a very high probability.
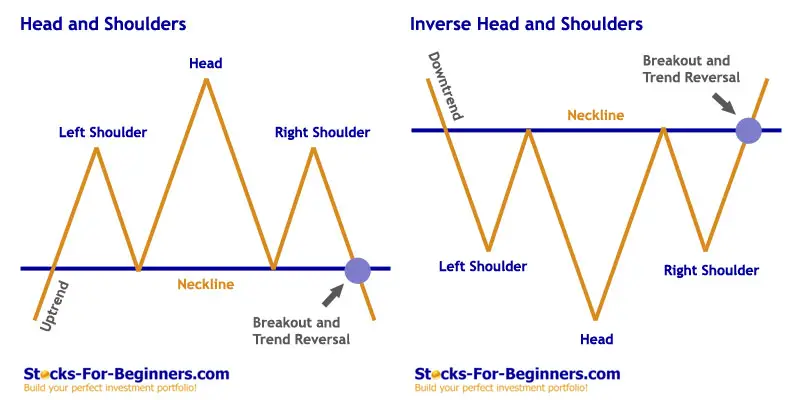
It usually takes three to six months for this chart pattern to complete and the duration of the trend prior to the pattern should be at least two times the duration of the pattern.
Volume is another important factor to watch with this pattern. Usually you will spot a very high volume at the left shoulder and then a raising volume toward head formation, while a lower volume is significant for the right shoulder. Breakout through the neckline is again supported with higher volume.
Double (Triple) Tops and Bottoms
This is another commonly used and reliable reversal chart pattern, which is formed after sustained trend exhaustion, signaling a very probable reversal. The more times that a stock price tests resistance or support level but is not able to breakthrough, the more reliable chart pattern you have, however, double tops and bottoms are much more prevalent than triple tops and bottoms. This type of stock chart pattern is confirmed, when the stock price crosses the lowest (highest) point in the pattern.
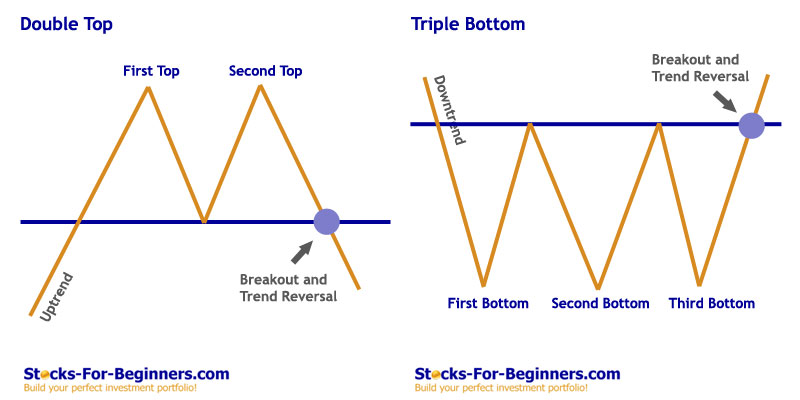
The more time it takes for the second (third) top or bottom to form, the more reliable pattern you have. It is not unusual that it takes even few months for this to happen.
Volume is usually higher when the first top or bottoms are formed and afterwards it reduces. There is normally a higher volume again at the breakout of the pattern support/resistance lines. The higher the breakout volume, the more reliable pattern you have.
Rounding Bottom
The rounding bottom pattern is a long-term reversal pattern that can last from several months to several years.
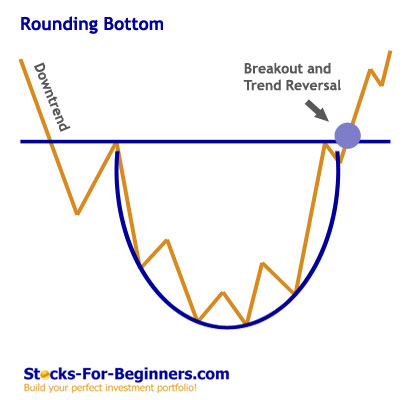
It looks similar to cup and handle pattern but without the handle and it signals a shift from downtrend to uptrend. This pattern is quite difficult to trade since its long-term nature.
Continuation or Reversal Chart Patterns
Triangles
Triangles are another popular chart pattern used by chartists. Three types of triangles exist, the symmetric, ascending and descending and their formation normally lasts from few weeks to few months.
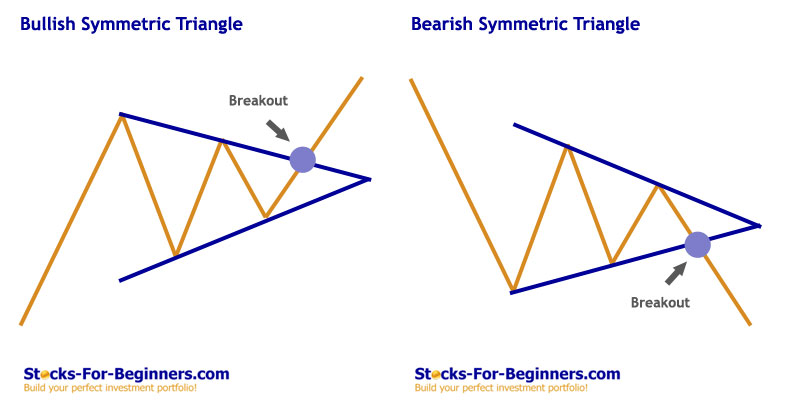
The symmetric triangle is formed out of two converging trend lines and is neither bullish nor bearish in terms of future price direction (it can be a continuation or reversal pattern). The bullish ascending triangle has a flat upper trend line and an upward sloping bottom trend line. The bearish descending triangle has a flat lower trend line and a downward sloping upper trend line.
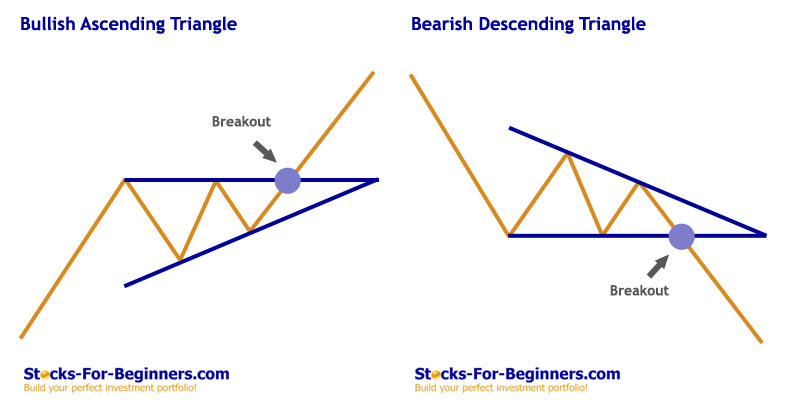
The triangle pattern usually has two or three tops and bottoms, forming the basis for trend lines and afterwards you can expect the trend line to be broken. A broker trend line of the triangle pattern suggests the completion of the pattern and this should happen at about 2/3 of the horizontal length of the pattern - much earlier than the trend lines merge.
The volume is normally reducing with the pattern formation, but on the breakout the volume is above average. If the breakout is not supported with higher volume, you should be very careful when trading this pattern.
Wedge
A wedge pattern is similar to symmetric triangle - it can be a continuation or reversal pattern, with two differences.
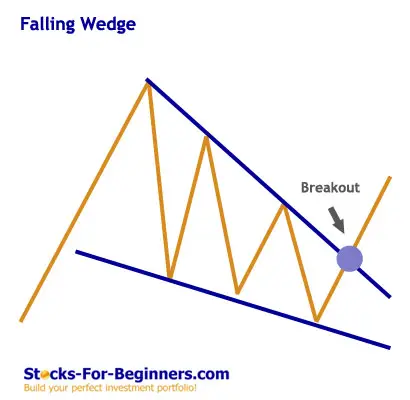
While the triangle shows sideways movement, the wedge can move either upward (normally bearish sign) or downward (normally bullish sigh). The other difference is that wedge normally takes much longer to complete then triangle, usually between three and six months.
Continuation Chart Patterns
Cup and Handle
This bullish continuation stock chart pattern is presenting a medium-term break before continuation in the long-term upward direction.
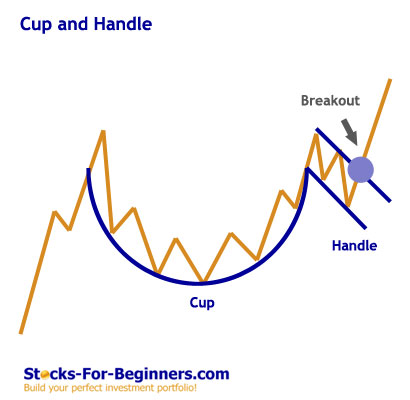
After a long lasting uptrend the price pattern forms a cup - a combination of downward and sideways movement. After touching the prior high a handle is formed and when the upper trend line of the handle is broken, the pattern is completed and the upward trend can continue. This pattern can range from several months to more than a year.
Flag and Pennant
Flag and pennant are two short-term continuation stock chart patterns, lasting for one to three weeks normally. They arise after a sharp stock price movement, when the bulls or bears take a break before they continue to push further in the same direction.
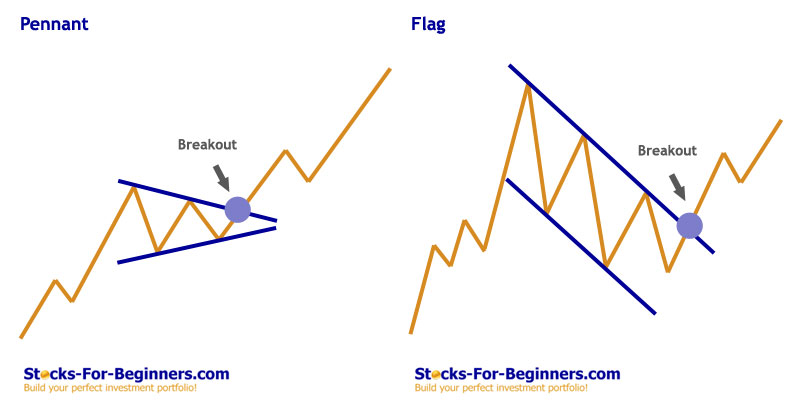
While pennant with converging trend lines looks much like symmetric triangle, the flag pattern with two parallel trend lines looks much more like a channel. The pattern is considered to complete, when the trend line in the direction of the basis trend is broken.
Recommended Reading - Recommended Reading - Recommended Reading - Recommended Reading
Back To Technical Stock Analysis Index...
Next step: Trading moving averages...
Written by: Goran Dolenc
Do you find this content useful? Like! Tweet! Recommend! Share!
Back from Stock Chart Patterns to Investing in Stock Market
Back from Stock Chart Patterns to Best Online Trading Site for Beginners home page


