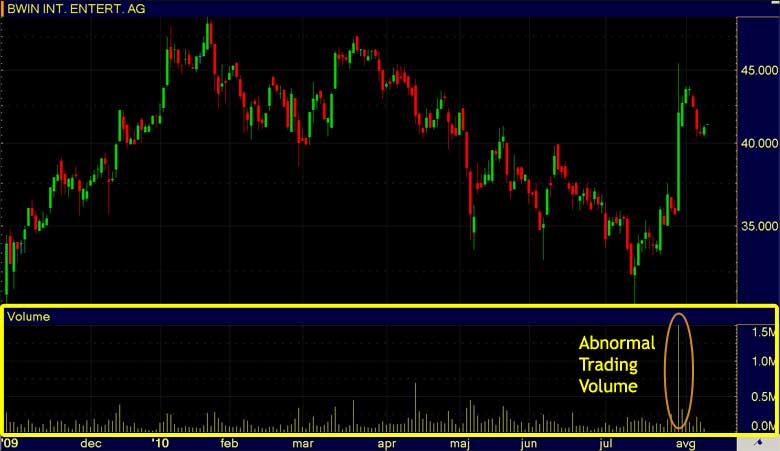
Abnormal Trading Volume Analysis
It is not only the price of a stock that attracts technical analyst's attention, abnormal trading volume is also extremely important part of stock market research.
Abnormal trading volume research is beside stock price the second most important part of technical analysis, because volume suggests you the how powerful was the price move in either direction or you can use it as confirmation indicator for chart patterns.
Volume measures how many shares - absolute number - were traded on a specific day or in a given period of time; for example McDonalds Corp. (MCD) trading volume on NYSE on 08-09-2010 was 8,924,810 shares). Higher volume suggests that security is very actively traded. To eliminate daily specifics in trading, financial portals and other data providers often publish monthly and yearly average trading volume next to daily.
Beside volume you will sometimes find the turnover data, which measures the worth of traded shares in a currency of the market; for example McDonalds Corp. (MCD) turnover on NYSE on 08-09-2010 was around $650 million).
Chartists are especially looking for abnormal trading volume, the one that departs from the monthly or yearly averages. The easiest way to determine above average trading volume is to analyze the charts, which usually plot volume in the form of volume bars in a separate frame at the bottom of the chart. Each volume bar illustrates number of shares traded per period; for example, if you have a daily chart with time-period of 5 minutes, than every volume bar shows you number of traded shares in those 5 minutes.

Trading Volume As Confirmation Of Price Change
Volume, especially abnormal trading volume is important data you should follow carefully, because it is the way of confirming trends and chart patterns. Any significant price move in either direction is seen as more relevant if it is supported by strong trading volume; week volume moves are not so powerful than high volume moves.
If for example a stock price which is in a downtrend, suddenly gaps up by 5% it gets your attention, since it could suggest the reversal. But this extreme move in stock price could be supported by week, average or strong trading volume. If the volume in the period of significant price change was low, it might be difficult to support true trend reversal. On the other side, if the price move was based on abnormal trading volume, it is very probably that the reversal is for real. Therefore you should always look at the volume in case of large price movements to confirm or reject the same story.
Stock price and stock trading volume usually go hand in hand, meaning, if the price is in an uptrend (downtrend), also volume should be in an uptrend (downtrend). If volume and price go each in its own way - for example the price is going up while the volume is lowering - this is a sign of weakening uptrend in stock price and it might soon end. The situation when the price is telling you different story than trading volume is named "divergence".
Trading Volume and Chart Patterns
You can use trading volume analysis also as confirmation indicator for chart patterns, such as head and shoulders, flags, triangles, and others. Every chart pattern has its own pivot points that are crucial for chartist's interpretation. If this pivot points are supported by abnormal trading volume, the quality of the signal is much stronger than in case of week volume. I will discuss chart patterns in more detail in separate article.
Which Is The Leading Indicator: Price or Volume?
Technical analysis is suggesting that stock price is preceded by trading volume. Chartists therefore closely monitor volume to form ideas on upcoming reversals in trend. If volume starts decreasing in an uptrend or downtrend, it is a sign that trend reversal will come soon.
Recommended Reading - Recommended Reading - Recommended Reading - Recommended Reading
Back To Technical Stock Analysis Index...
Next step: Stock market technical analysis charts...
Written by: Goran Dolenc
Do you find this content useful? Like! Tweet! Recommend! Share!
Back from Abnormal Trading Volume to Investing in Stock Market
Back from Abnormal Trading Volume to Best Online Trading Site for Beginners home page


