Use of Stock Market Trend in Technical Analysis
Identifying stock market trend is one of the most important steps of technical analysis and then acting in the direction of the trend rather than going against it.
Stock market trend is one of the most important concepts of technical analysis. The most basic definition of the term "trend" is the direction in which a stock price is heading. Most of the times it is very simple to determine the trend just by looking at the chart, however, there are situations when it is not so easy to see it - for example when the stock price is moving up and down without clear indication of the future direction.
Formal Definition Of Stock Market Trend

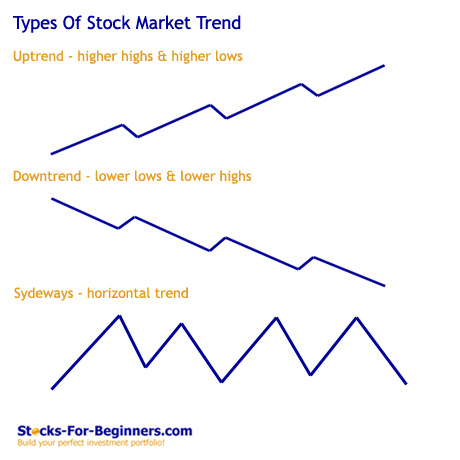
The formal definition of stock market trend is especially helpful in case when defining a trend is not so obvious - since stock prices do not move in a straight line up or down, but rather in series of highs and lows, it is the movement of the latest that defines the trend. The stock is in a downtrend if there is a series of lower highs and lower lows and the stock is in uptrend, if there is a series of higher highs and higher lows. The stock continues to be in a downtrend as long as each consecutive high is below the previous high and the stock continues to be in an uptrend as long as each consecutive low is higher than the previous low; otherwise the trend is deemed a reversal.
Types Of Stock Market Trend
Stocks can move up, down or nowhere. Financial theory has therefore defined three types of trend: uptrend, downtrend and sideways. If peaks and troughs are higher it is referred as uptrend, is peaks and troughs are lower it is referred as downtrend, and in case of little movement up or down in peaks and troughs, it's a sideways trend. Sideways trend, often called as horizontal trend, is actually not a trend on its own - it is better described as lack of defined trend in either direction: up or down.
Length Of Stock Market Trend
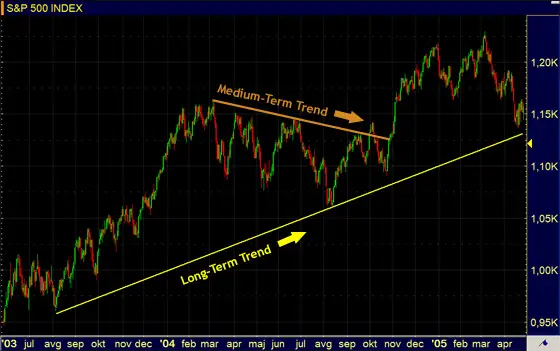
Besides three basic directions of the trend there are also three trend classifications according to its length: long-term, intermediate and short-term trend. In terms of stock market investing, long term trend (also known as major trend) is lasting longer than a year - often 3-5 years, an intermediate trend is lasting few months and short-term trend is anything less than a month. For stock traders' different definitions of length of trend applies; for a day-trader long-term trend lasts only few hours for example.
Long-term trend consists out of many intermediate and short-term trends, which can move in the same or against the direction of the major trend. As long as the major trend continues to move in the same direction, the situation is defined as medium-term or short-term corrections, which is not the same as stock market trend reversal, when the major trend changes its direction of future movement.

When you will be analyzing stock market trends, you should construct the chart time-frame and time-period to best reflect the type of trend being analyzed. As investor you should be identifying long-term trend with weekly chart over five-year, for analyzing intermediate trend you should use daily chart over 6 months period, and for short-term trends you should use daily chart over last few days for example. It is very important to remember, that long-term trends are much more powerful than short-term trends; for example, 5-days trend is not as significant as a three-year trend.
Trendlines
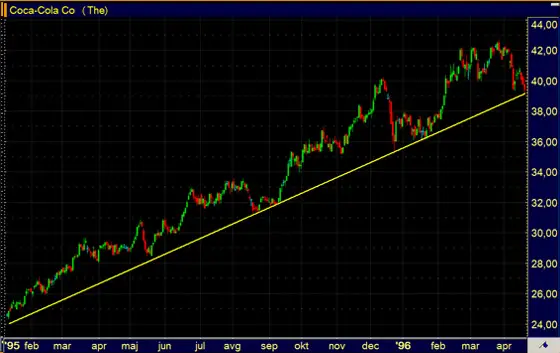
Trendlines are simple straight lines drawn on the chart with charting tools to more clearly represent the general trend in the market. Trendlines are also used as identification of trend reversal.
You should connect all the major lows when drawing the trendline in the uptrend and this line will represent the support level of the stock in every midterm or short-term correction. Similarly, you should connect all the major highs when drawing the trendline in the downtrend and this line will represent resistance level of the stock in every intermediate or short-term correction.

Trend Channels
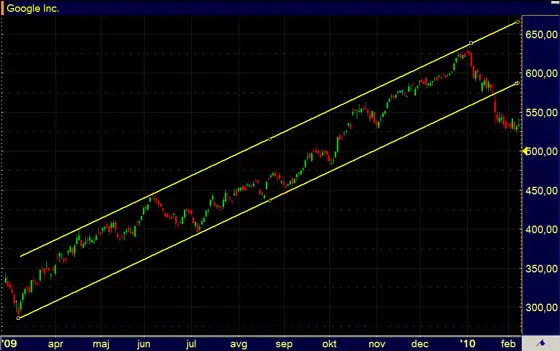
The trend channel is constructed out of two parallel trendlines - one is connecting series of lows and the other is connecting series of highs, which act as strong support and resistance levels; you can notice while looking at different stock charts, that price is bouncing off of these lines several times. While a channel can slope downward, sideways or upward, the interpretation is the same for all of them - traders expect a given stock to trade within the channel lines, until the breakout occurs beyond support or resistance; in this case a sharp move in the direction of breakout is very common.

Importance Of Stock Market Trend
As investor or trader it very important for you to understand, that acting in the direction of the trend is far more safe strategy than going against them - contrarian. You have probably heard of well known saying in technical analysis "the trend is your friend" or "Follow the money", illustrating the importance of the trend analysis in trading or investing.
Recommended Reading - Recommended Reading - Recommended Reading - Recommended Reading
Back To Technical Stock Analysis Index...
Next step: Stock market technical analysis and importance of support and resistance trading levels...
Written by: Goran Dolenc
Do you find this content useful? Like! Tweet! Recommend! Share!
Back from Stock Market Trend to Investing in Stock Market
Back from Stock Market Trend to Best Online Trading Site for Beginners home page


