Best Online Stock Trading Signals Center
Enjoy the best online stock trading signals center, where we group trading ideas based on technical analysis from most successful free online resources.
If you would have to choose one thing newbie's to trading and investing are most often looking for on the web today, you would probably guess that most wanted information is related to Where to Invest Money? Which stocks, Exchange Traded Funds (ETFs), commodities, currencies or stock indices provide you trading opportunities you shouldn't miss today, tomorrow? If you have ever been searching for trading signals on the internet you know that several sources exist. The problem is, not many sources are free and successful at the same time. Either you have to subscribe to paid service or you are left with only some of free teasers - trading signals per month. Our goal is to gather some of the most reliable resources which provide best online stock trading signals for free and provide them to you in finished form. You can read more about the idea of our new Best Online Stock Trading Signals Center at the end of this article, now we would like to give you what you have visited us for - trading ideas.
This is beta version of best online stock trading signals center. Only few signals are provided currently, to test your opinion and we do not plan to update this site for few days. Please feedback us with constructive comments about this module, which can be provided via contact form or Facebook comments. We plan to go live with this center in the beginning of 2012, hopefully with some improvements provided by you.
Open Signals - Waiting for Entrance Triger
In the table bellow, you can find mostly fresh stock trading signals, which were published today or in the last few days. The thing is, that we manually review every signal provided to us via the RSS/XML feeds and pull out the most important figures out of it, which are: should you buy or sell (go long or short), should you trade immediately or you should wait for some condition to meet criteria (order entry type: market, limit, stop), price level at which we should enter the position, and lastly price target you hope to see in the future and level at which you have to protect yourself against bigger loss in case direction of selected stock changes unexpectedly. We also calculate the so called Risk/Reward ratio, which is a ratio of potential return against potential loss; the higher, the better. We decided to mark signals as expired if they do not meet the entrance criteria in 7 days after being published.
Important! If you move your mouse over the symbol, you will find chart analysis in the popup image; by moving the mouse away, the image will disappear. If you click on the symbol, you will move to the source article in the new window. Similar functionality is implied on last quotes; by moving mouse over, you will see a chart for the last 5 trading days of selected stock. By clicking the symbol a new window will be opened with Yahoo Finance profile of the selected company; this way you can quickly check all other important information for your investment decision, like fundamental ratios, etc.
| Sig.Date | Symbol | L/S | Entry Type | Entry | Target | SL | Last | Date | Source | Risk/Rew. |
|---|---|---|---|---|---|---|---|---|---|---|
| 04/12/12 | SLV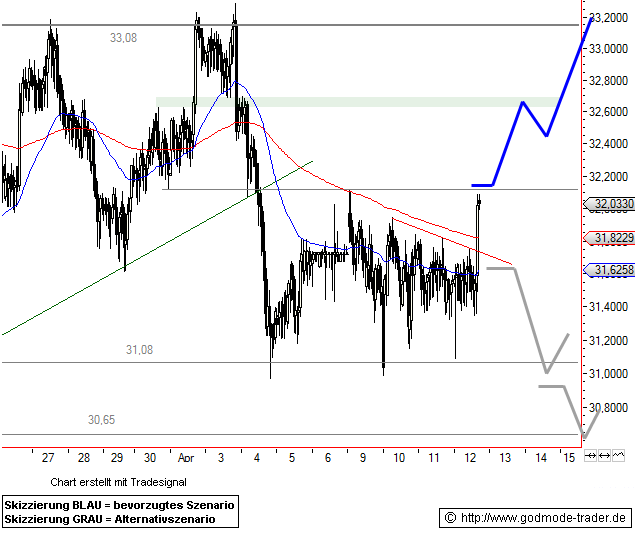 |
S | 33.36 |
02/02/12 | BoGo | |||||
| 04/11/12 | XOM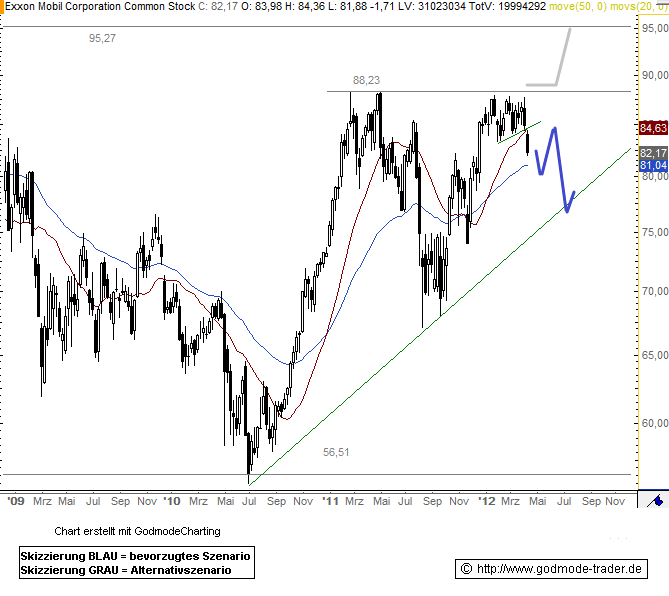 |
S | 83.53 |
02/02/12 | BoGo | |||||
| 04/11/12 | T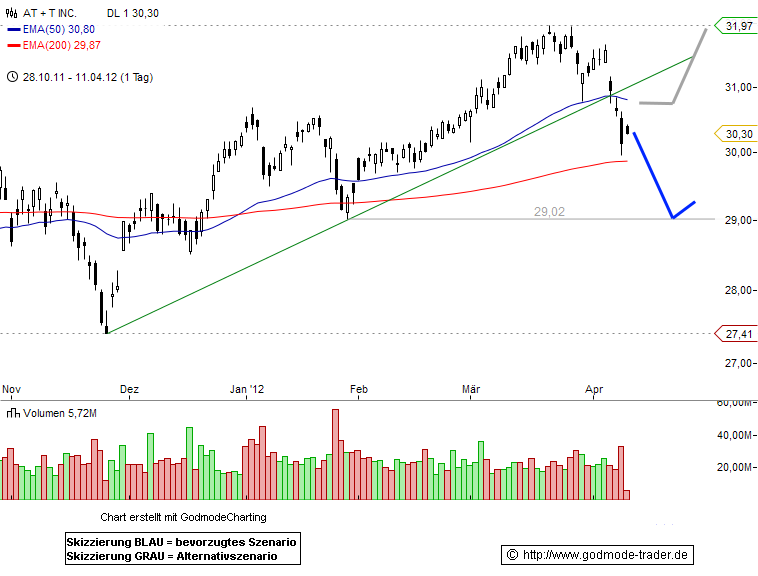 |
S | 29.79 |
02/02/12 | BoGo | |||||
| 04/10/12 | AA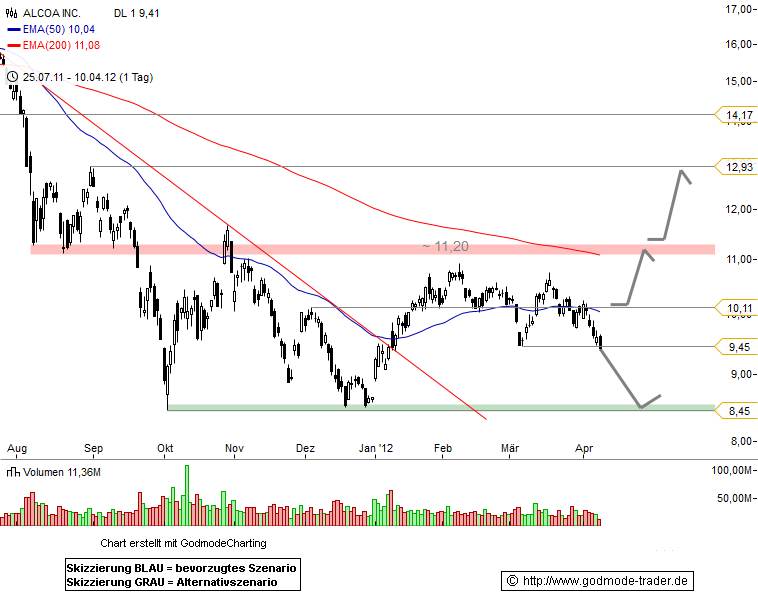 |
S | 10.42 |
02/02/12 | BoGo | |||||
| 04/10/12 | GOOG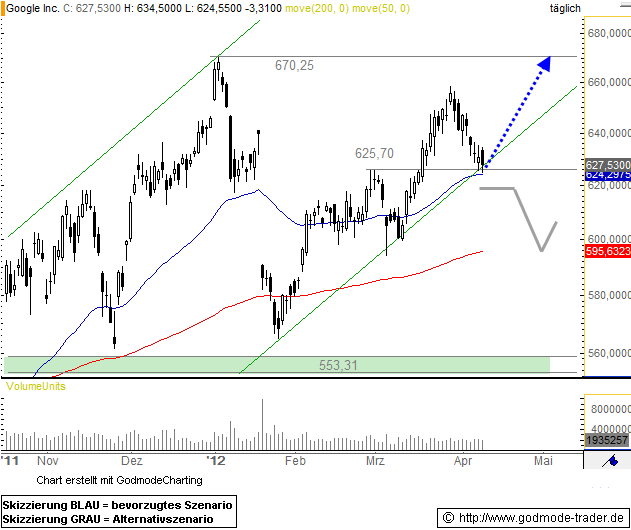 |
S | 585.11 |
02/02/12 | BoGo | |||||
| 04/10/12 | BAC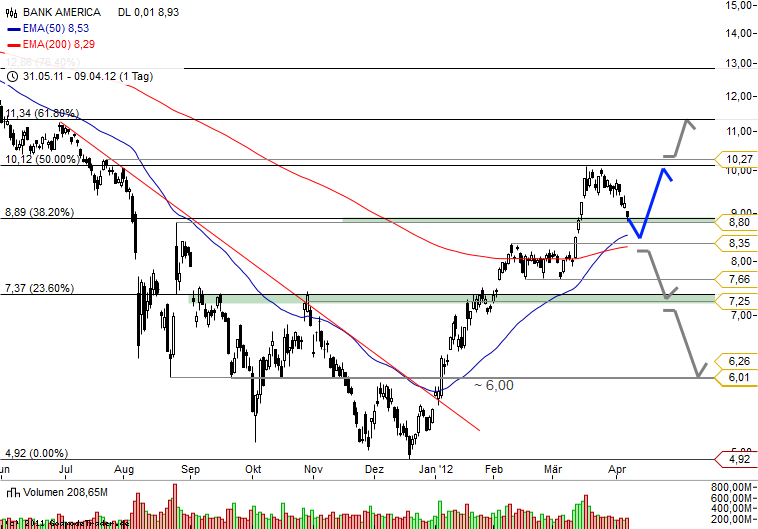 |
S | 7.45 |
02/02/12 | BoGo | |||||
| 04/10/12 | CVX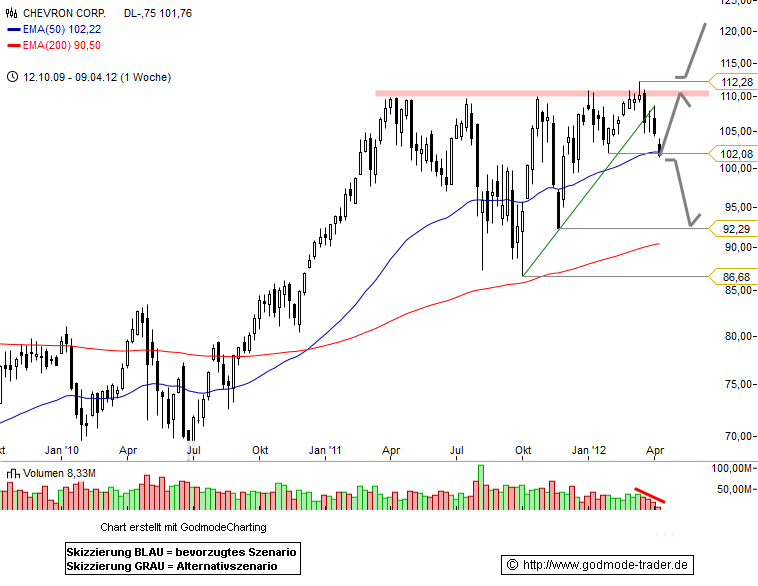 |
S | 103.69 |
02/02/12 | BoGo | |||||
| 04/10/12 | 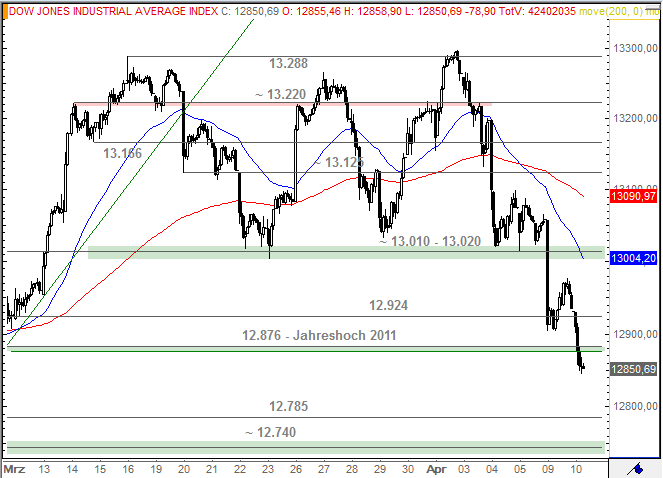 |
S | BoGo | |||||||
| 04/09/12 | MCD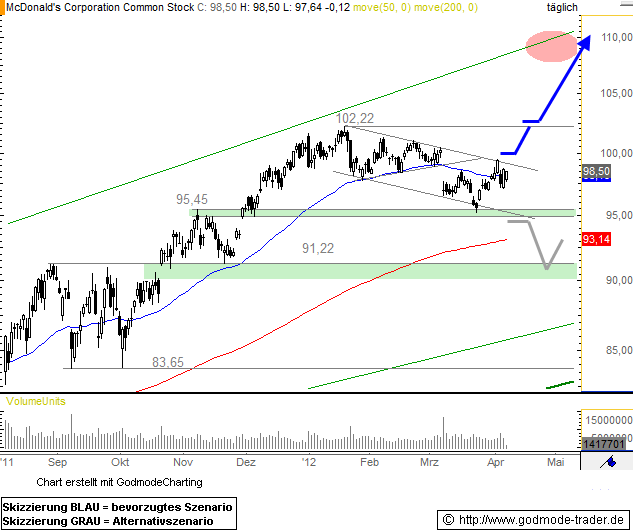 |
S | 98.62 |
02/02/12 | BoGo | |||||
| 04/09/12 | BIDU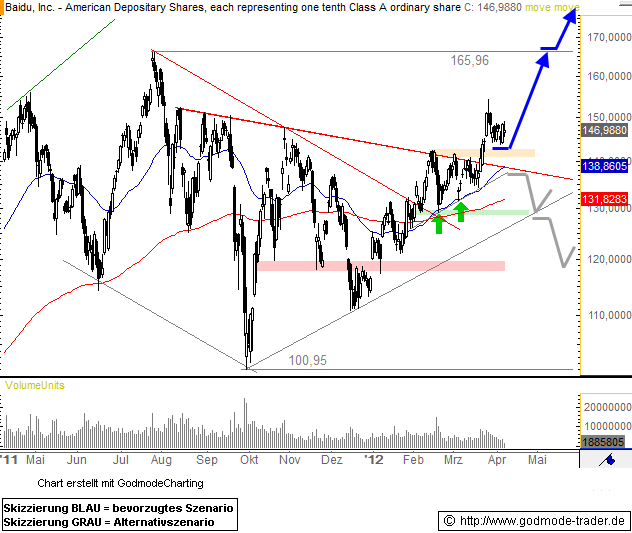 |
S | 130.79 |
02/02/12 | BoGo | |||||
| 04/05/12 | PFE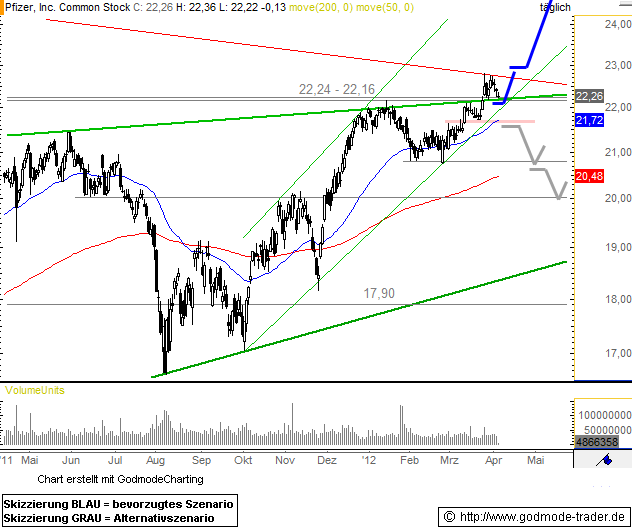 |
S | 21.11 |
02/02/12 | BoGo | |||||
| 04/05/12 | AAPL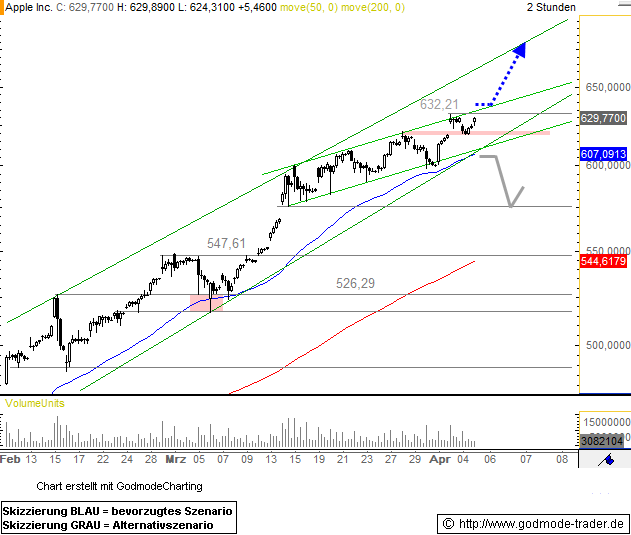 |
S | 455.12 |
02/02/12 | BoGo | |||||
| 04/04/12 | HD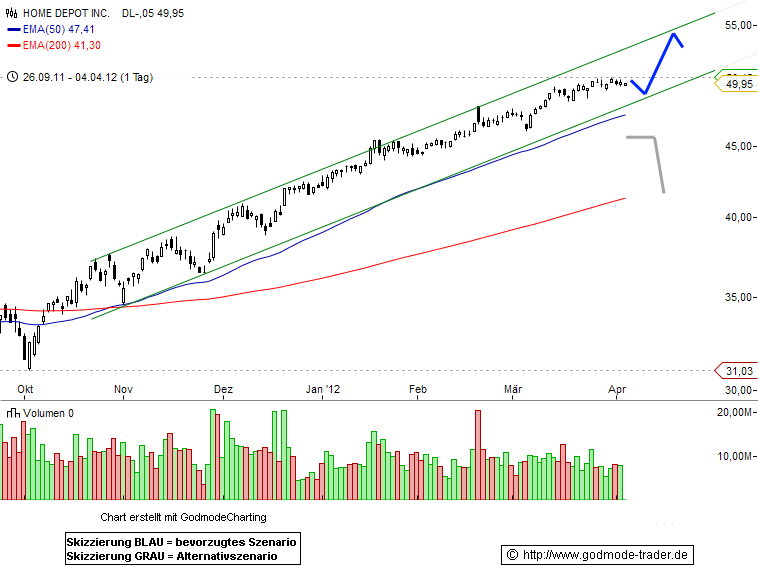 |
S | 44.46 |
02/02/12 | BoGo | |||||
| 04/04/12 | EBAY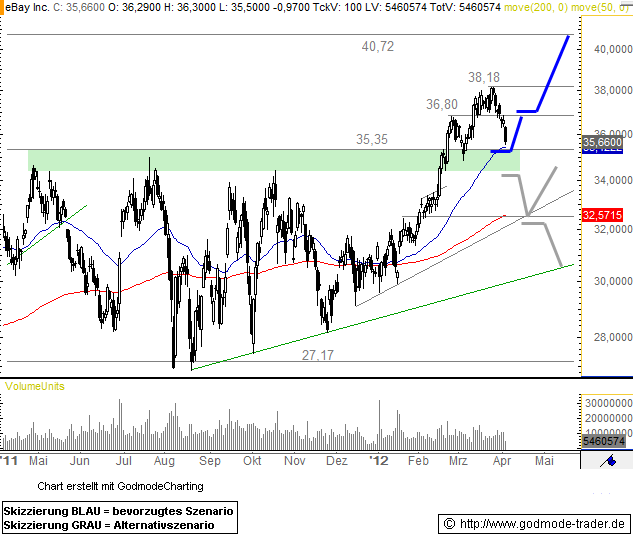 |
S | 32.70 |
02/02/12 | BoGo | |||||
| 04/04/12 | FSLR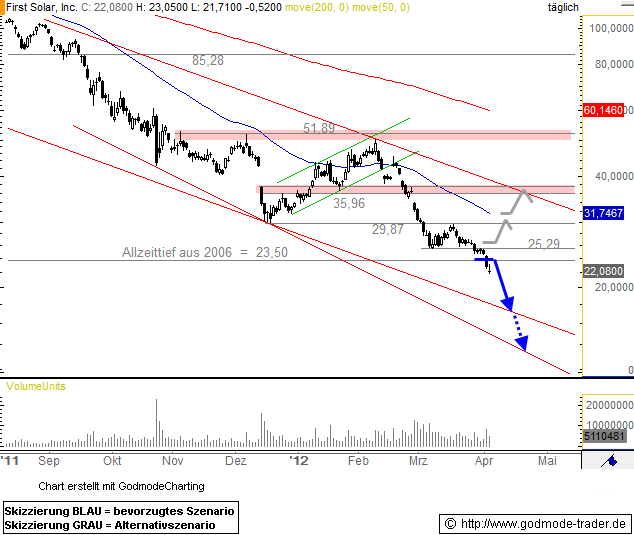 |
S | 44.74 |
02/02/12 | BoGo | |||||
| 04/04/12 | ADBE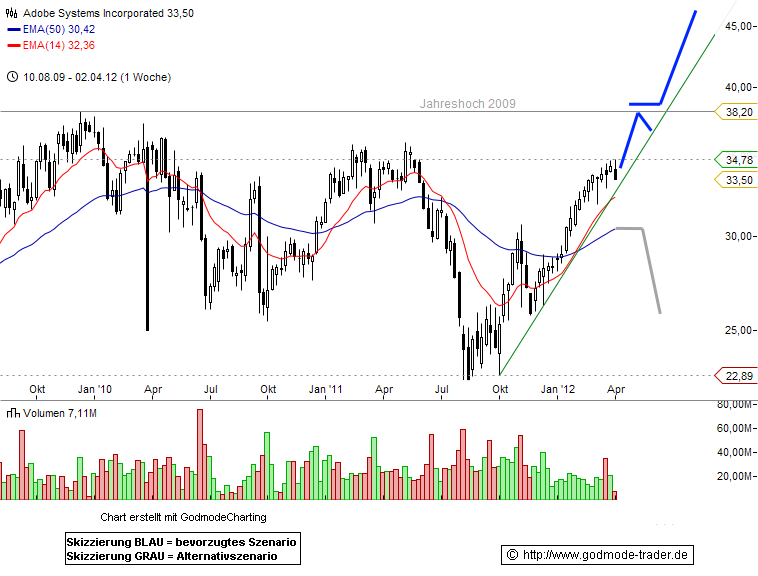 |
S | 31.29 |
02/02/12 | BoGo | |||||
| 04/04/12 | MSFT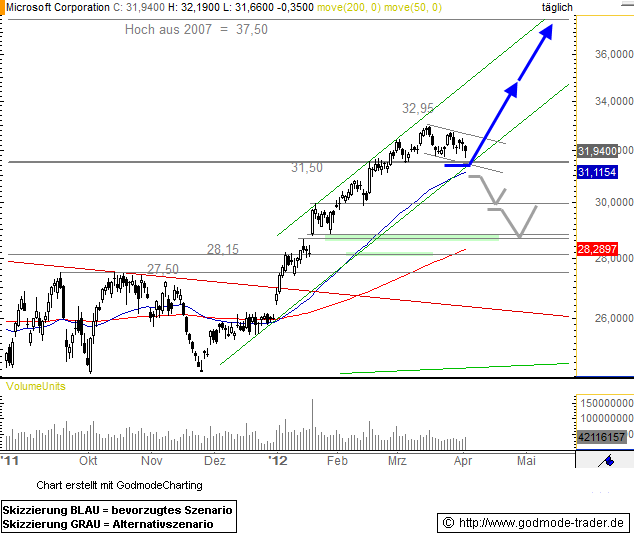 |
S | 29.95 |
02/02/12 | BoGo | |||||
| 04/03/12 | USO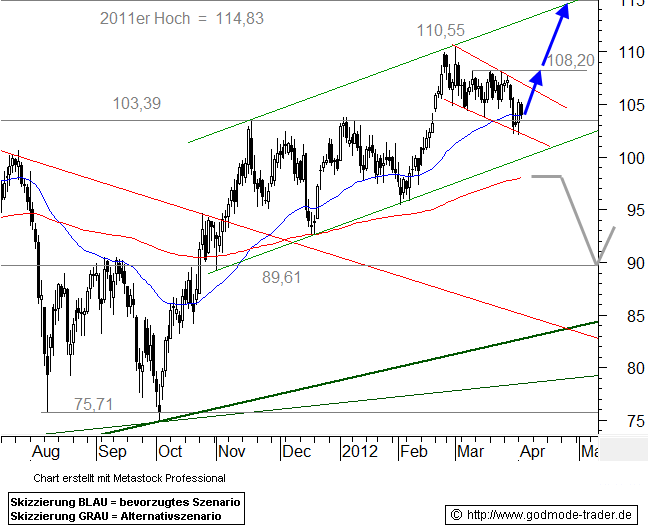 |
S | 37.13 |
02/02/12 | BoGo | |||||
| 04/03/12 | SLV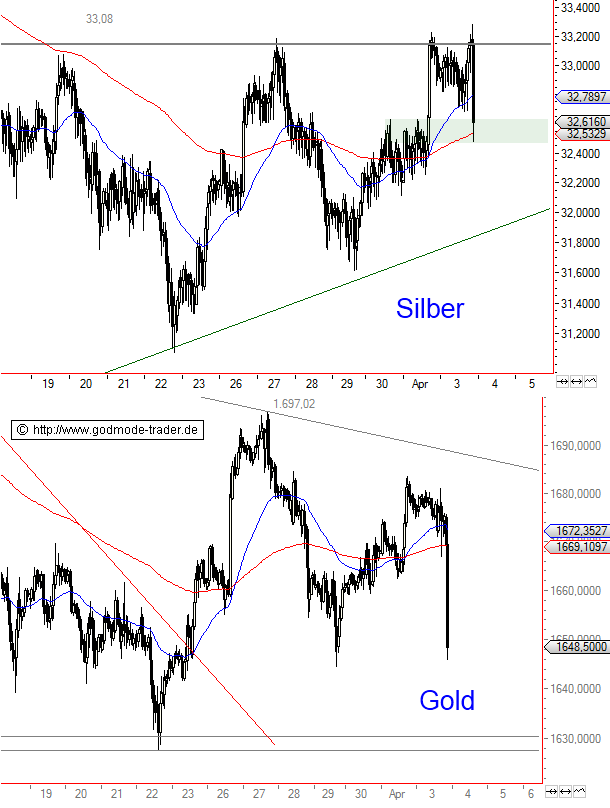 |
S | 33.36 |
02/02/12 | BoGo | |||||
| 04/03/12 | YHOO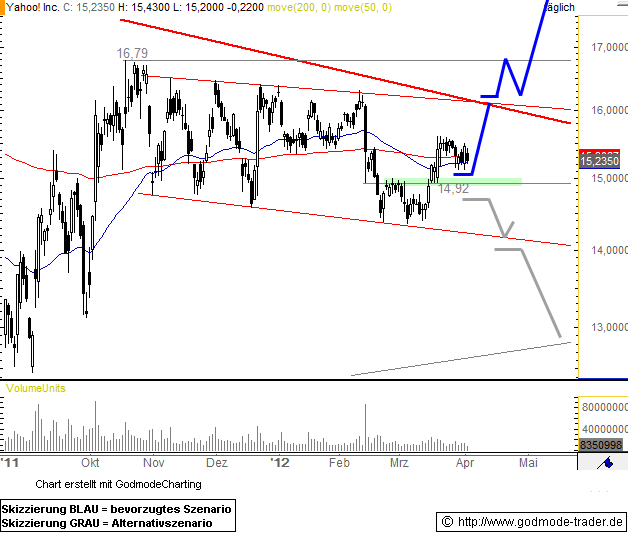 |
S | 15.72 |
02/02/12 | BoGo | |||||
| 04/02/12 | SPLS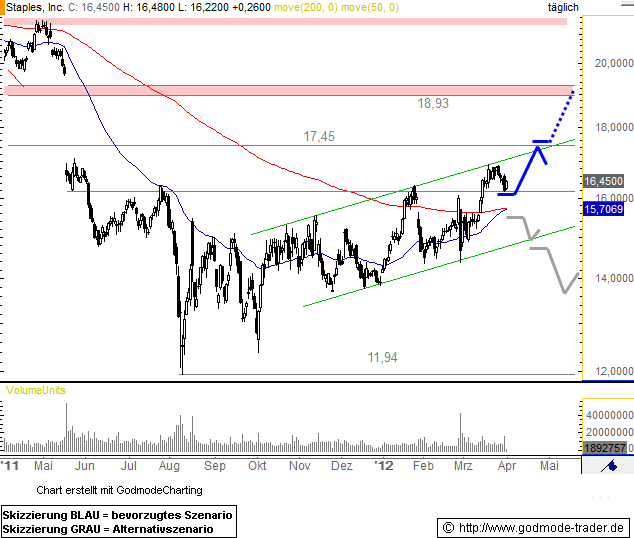 |
S | 14.49 |
02/02/12 | BoGo | |||||
| 04/02/12 | BA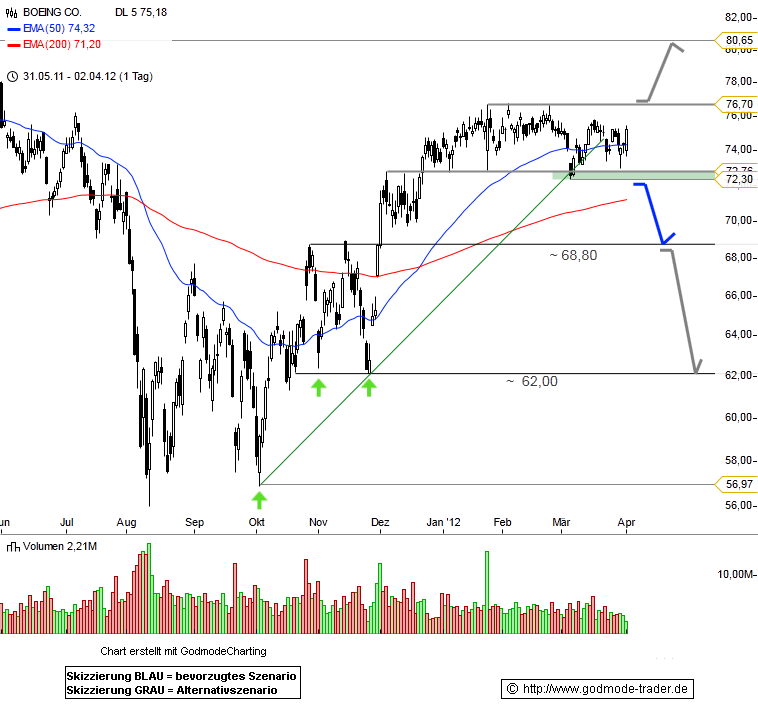 |
S | 75.22 |
02/02/12 | BoGo | |||||
| 04/02/12 | DELL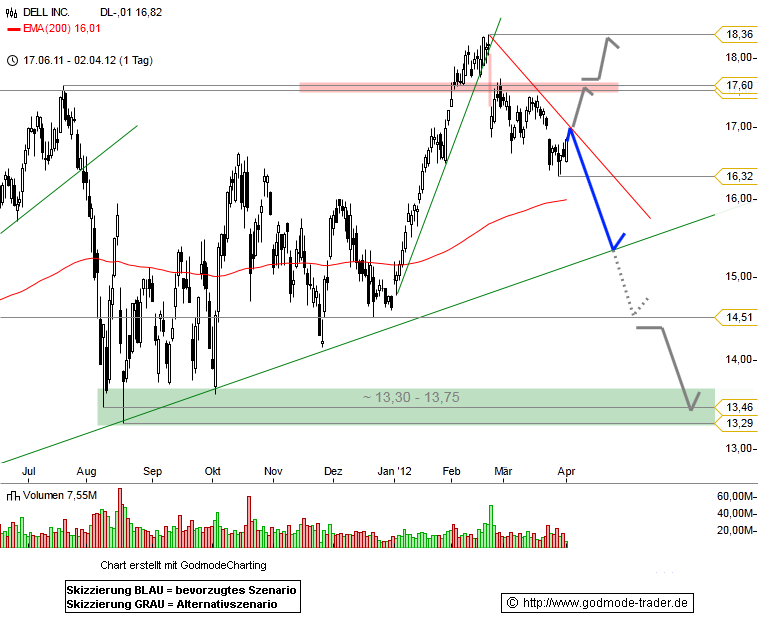 |
S | 17.60 |
02/02/12 | BoGo | |||||
| 04/02/12 | ORCL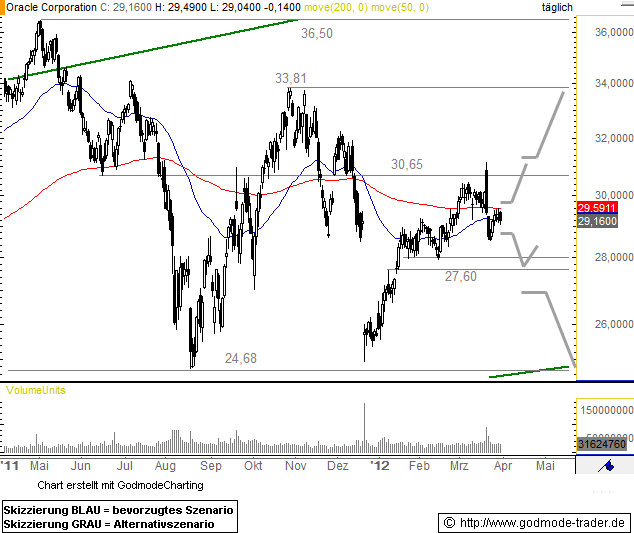 |
S | 28.81 |
02/02/12 | BoGo | |||||
| 04/02/12 | X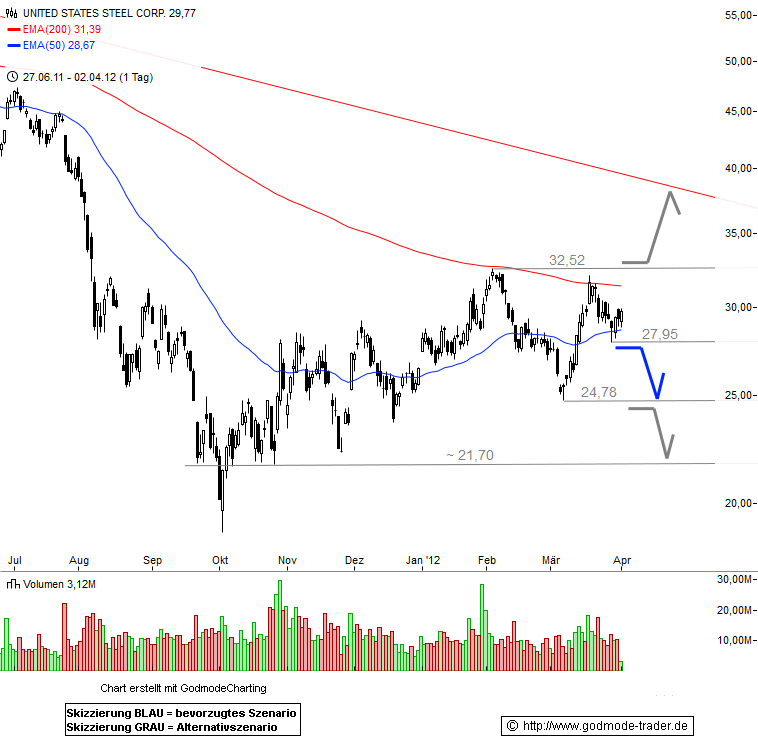 |
S | 31.44 |
02/02/12 | BoGo | |||||
| 03/30/12 | MCD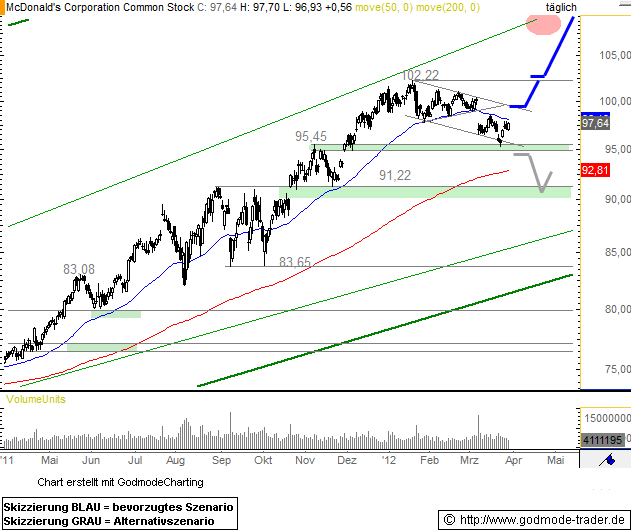 |
S | 98.62 |
02/02/12 | BoGo | |||||
| 03/30/12 | BIDU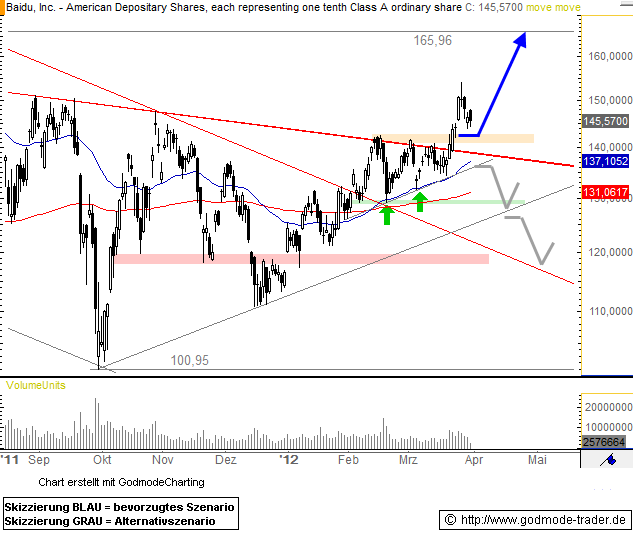 |
S | 130.79 |
02/02/12 | BoGo | |||||
| 03/29/12 | AMZN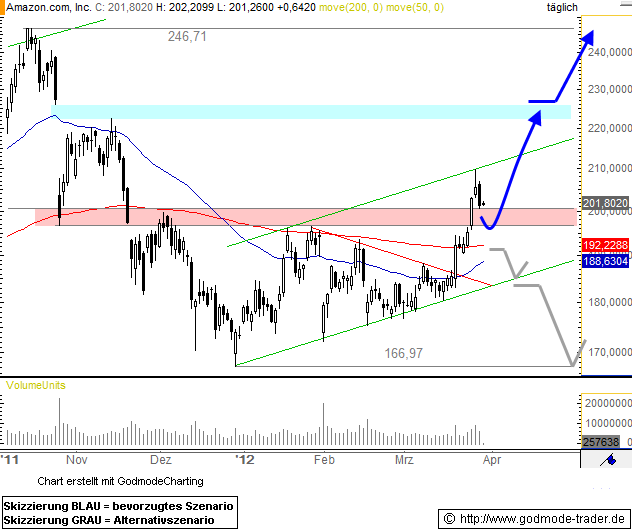 |
S | 181.72 |
02/02/12 | BoGo | |||||
| 03/29/12 | AAPL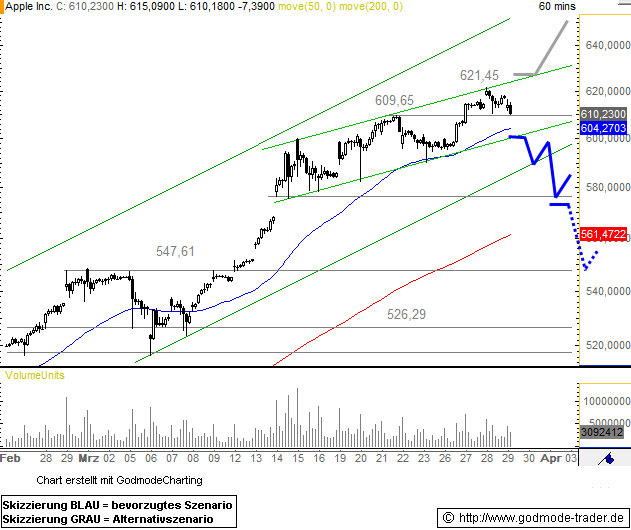 |
S | 455.12 |
02/02/12 | BoGo | |||||
| 03/29/12 | KO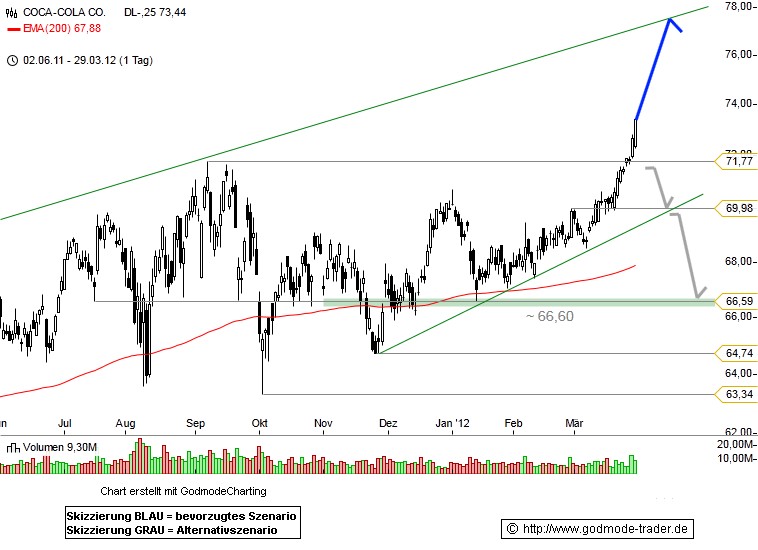 |
S | 67.83 |
02/02/12 | BoGo | |||||
| 03/29/12 | BBY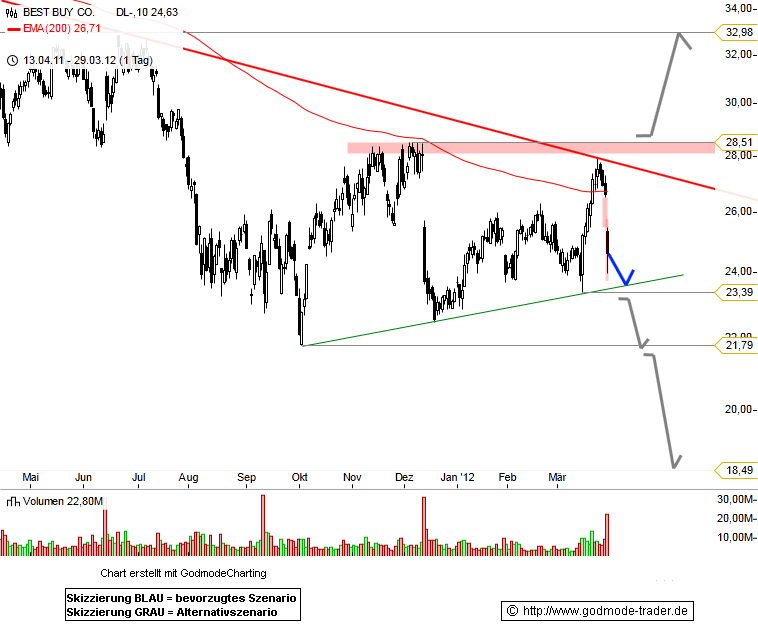 |
S | 24.30 |
02/02/12 | BoGo | |||||
| 03/29/12 | GS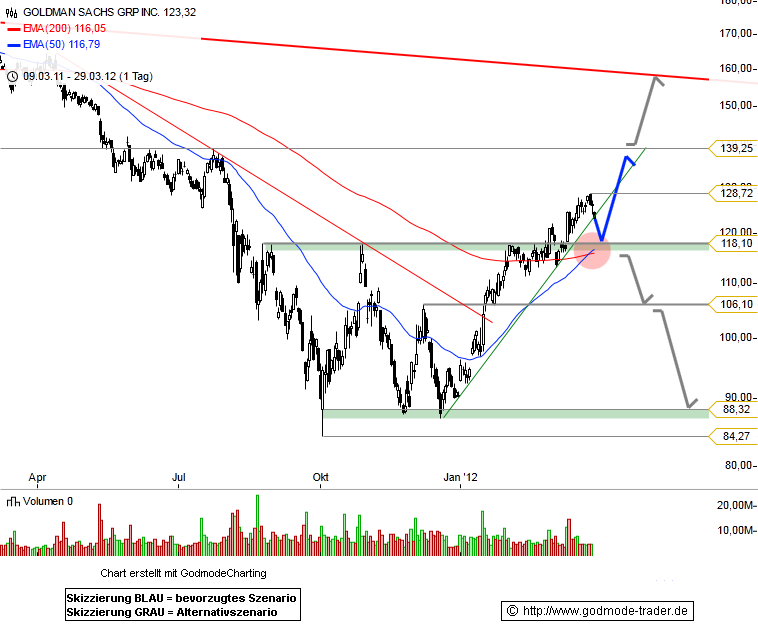 |
S | 113.39 |
02/02/12 | BoGo | |||||
| 03/28/12 | WMT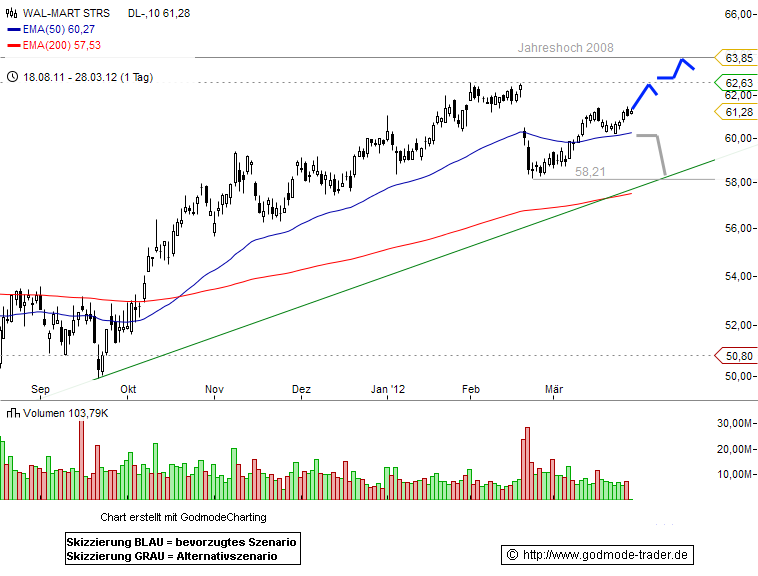 |
S | 61.94 |
02/02/12 | BoGo | |||||
| 03/28/12 | MMM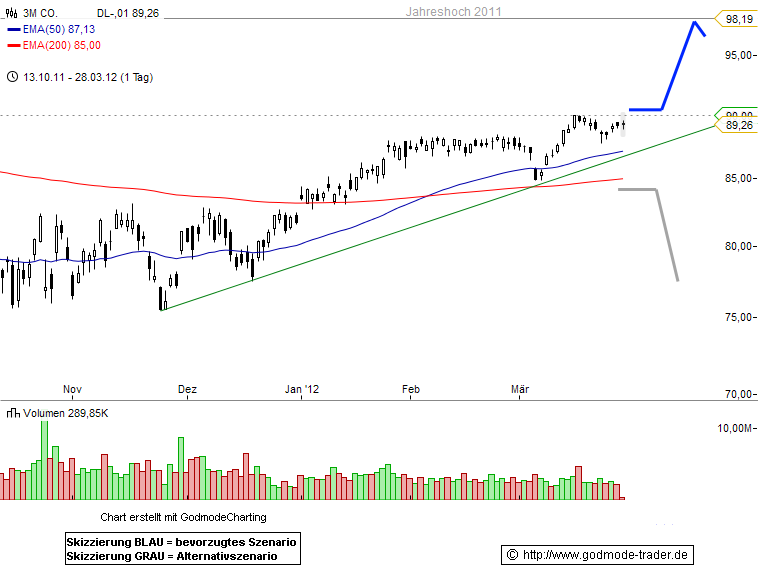 |
S | 87.43 |
02/02/12 | BoGo | |||||
| 03/28/12 | XOM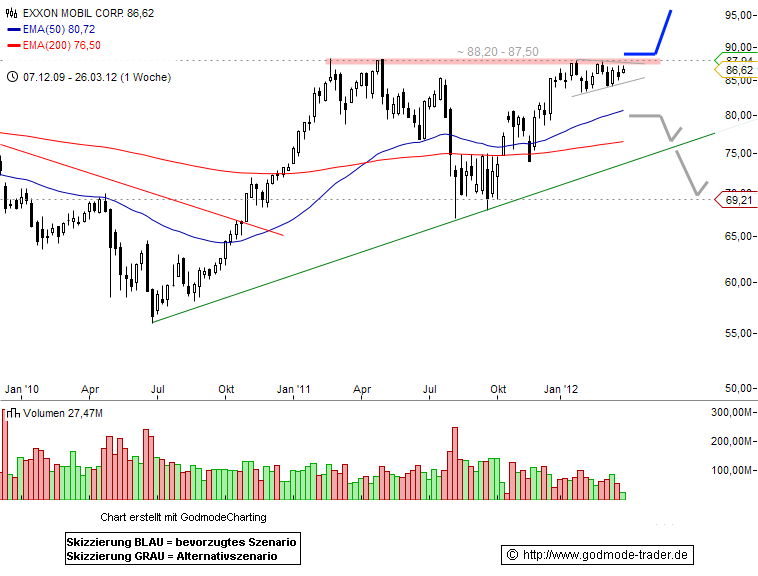 |
S | 83.53 |
02/02/12 | BoGo | |||||
| 03/28/12 | PG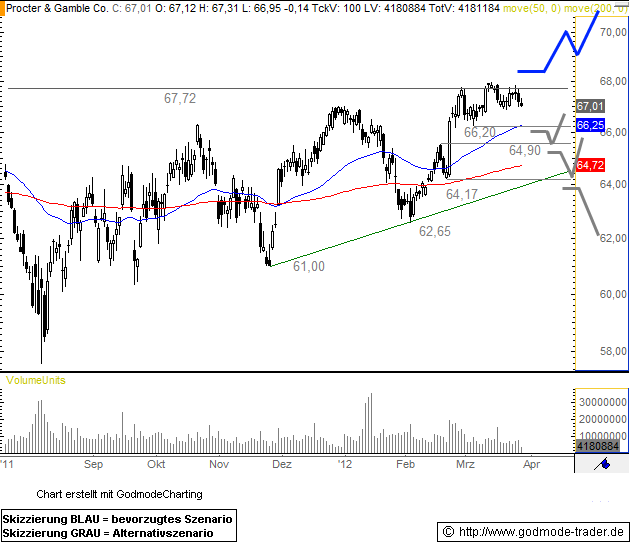 |
S | 63.32 |
02/02/12 | BoGo | |||||
| 03/27/12 | AMGN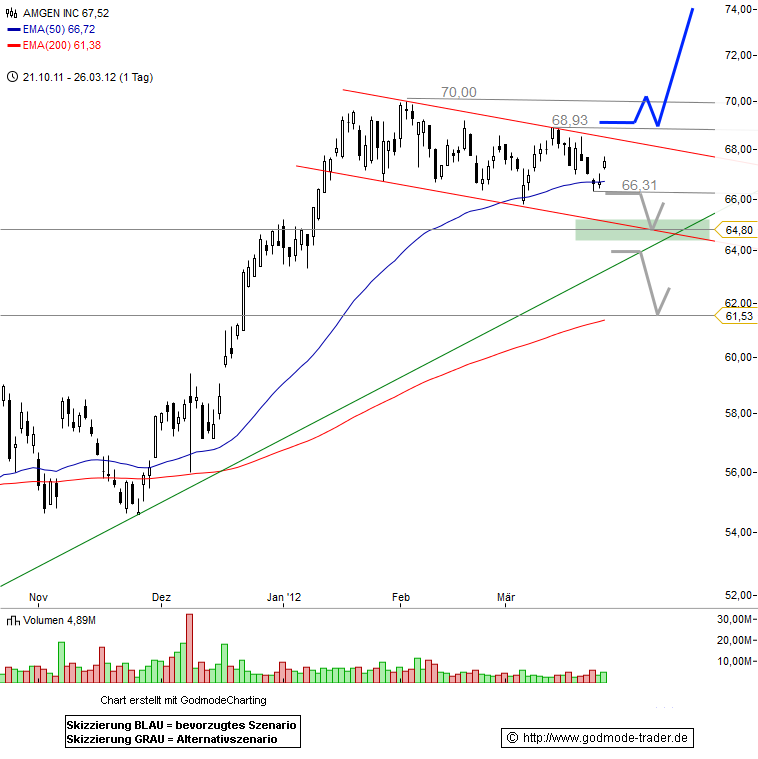 |
S | 69.62 |
02/02/12 | BoGo | |||||
| 03/27/12 | AMZN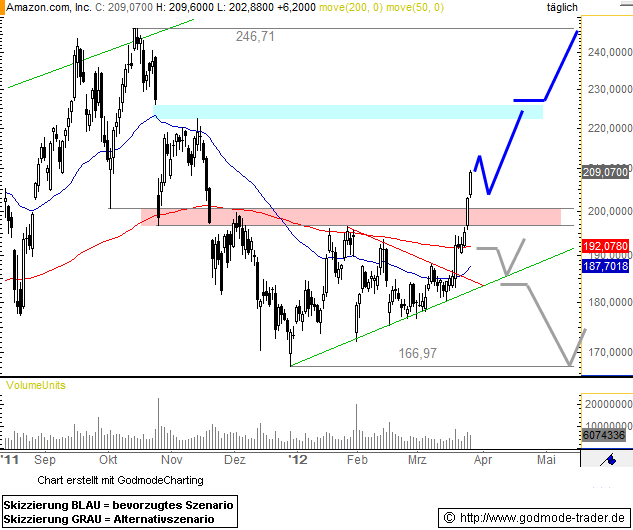 |
S | 181.72 |
02/02/12 | BoGo | |||||
| 03/27/12 | IBM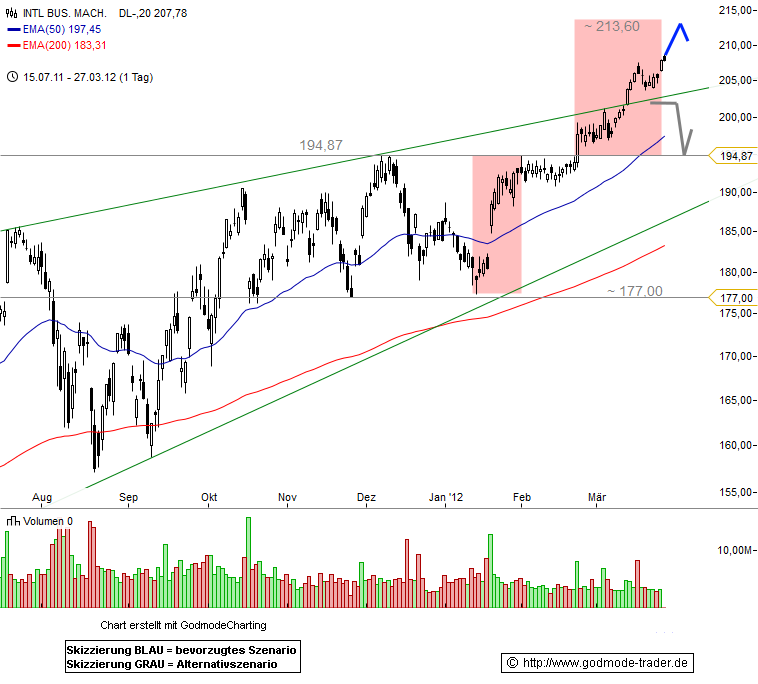 |
S | 191.53 |
02/02/12 | BoGo | |||||
| 03/27/12 | BAC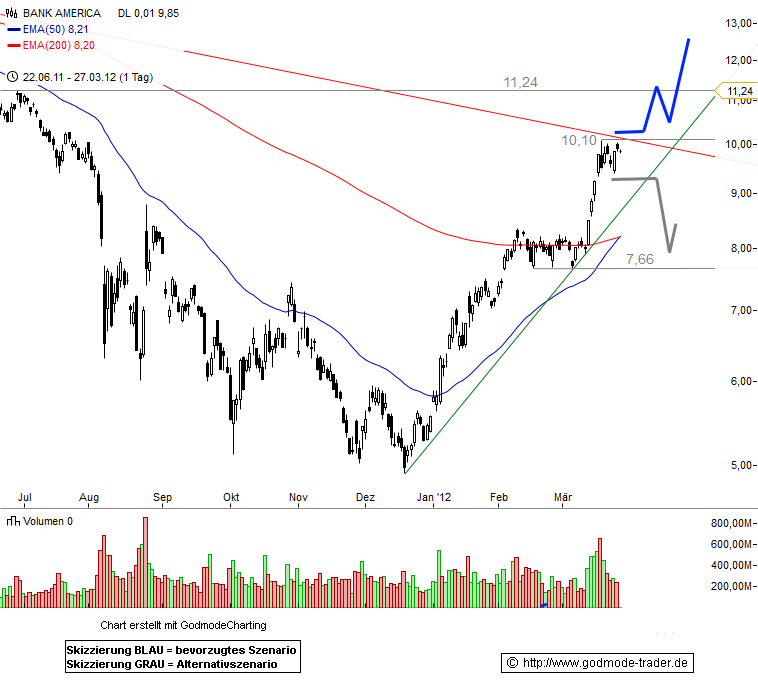 |
S | 7.45 |
02/02/12 | BoGo | |||||
| 03/27/12 | KO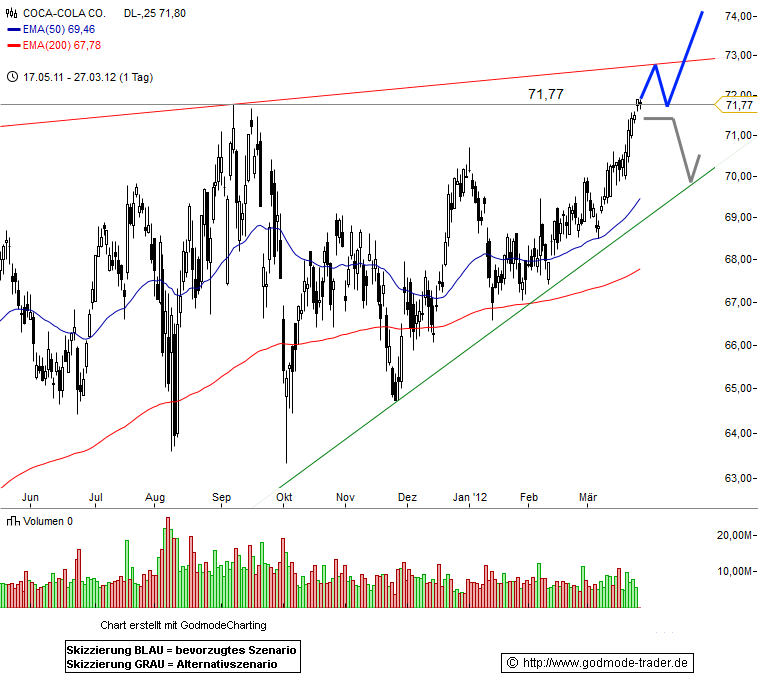 |
S | 67.83 |
02/02/12 | BoGo | |||||
| 03/27/12 | PFE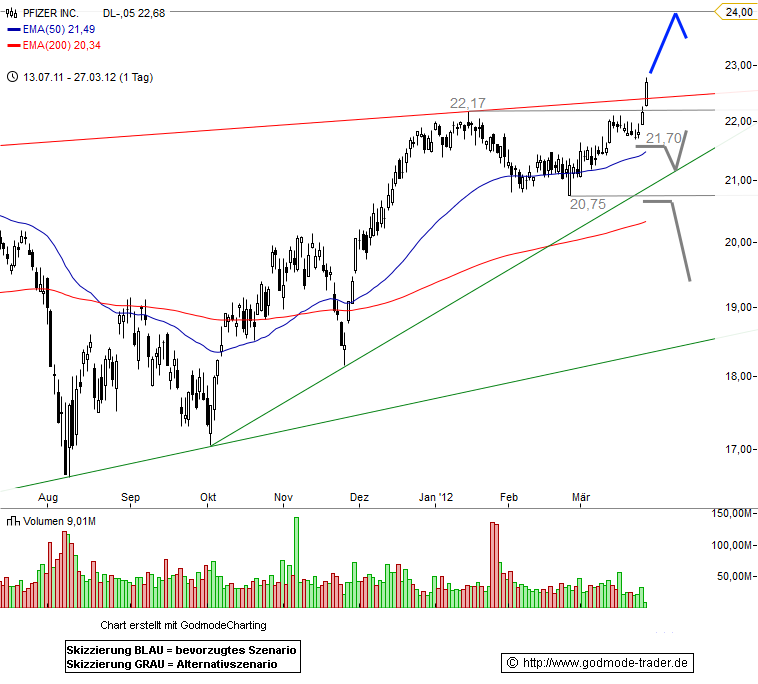 |
S | 21.11 |
02/02/12 | BoGo | |||||
| 03/26/12 | DIS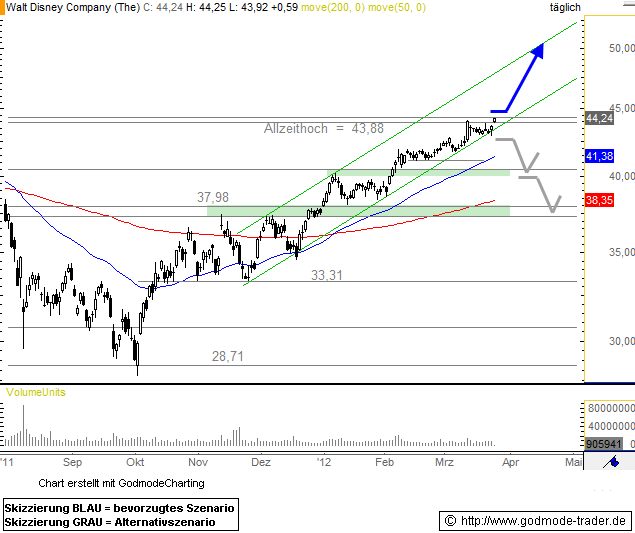 |
S | 38.91 |
02/02/12 | BoGo | |||||
| 03/26/12 | NVDA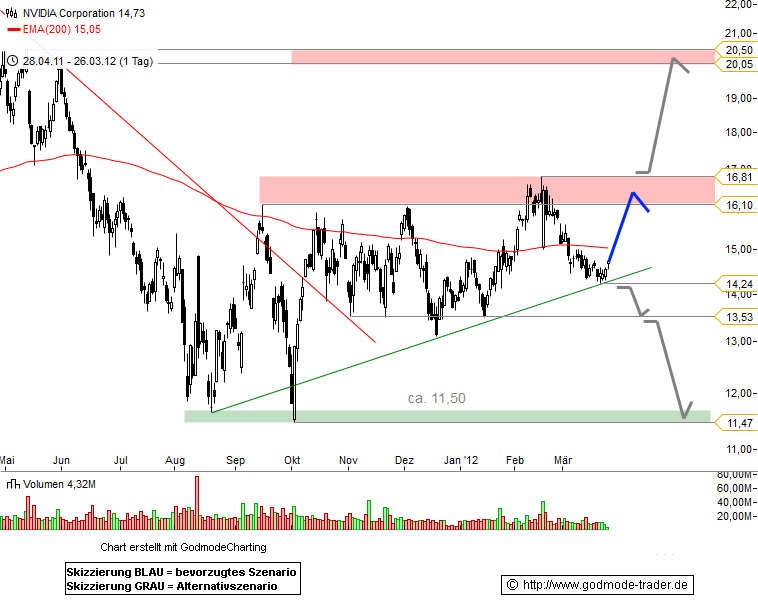 |
S | 15.49 |
02/02/12 | BoGo | |||||
| 03/26/12 | INTC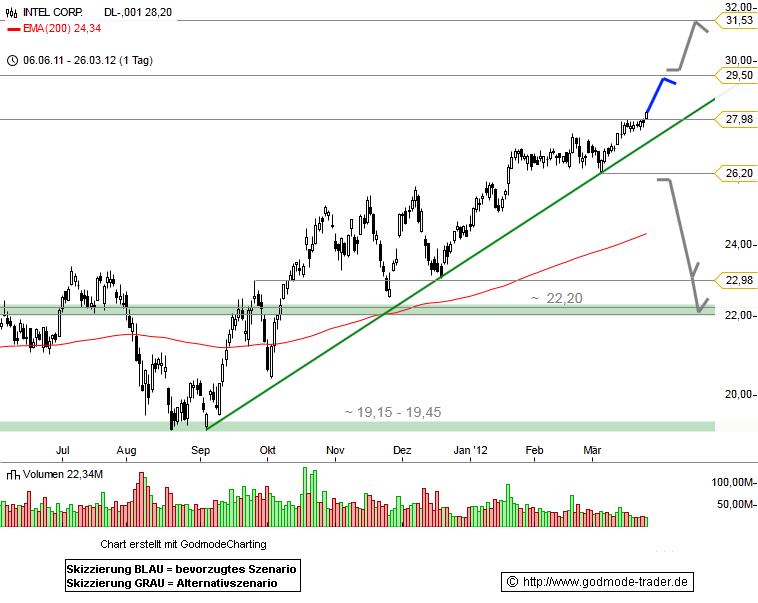 |
S | 26.49 |
02/02/12 | BoGo | |||||
| 03/22/12 | GOOG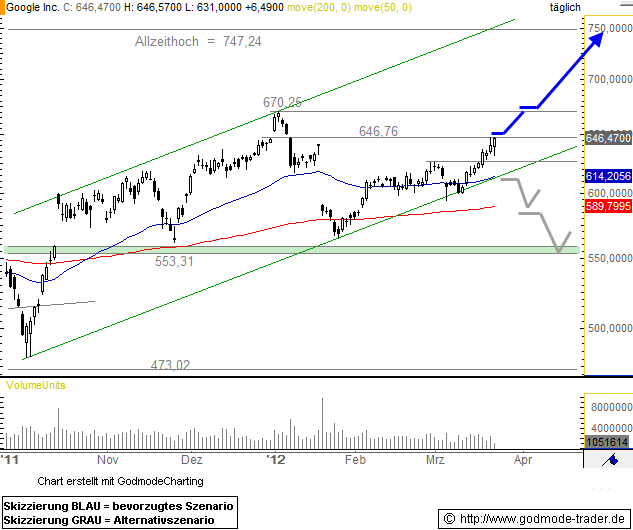 |
S | 585.11 |
02/02/12 | BoGo | |||||
| 03/22/12 | BIDU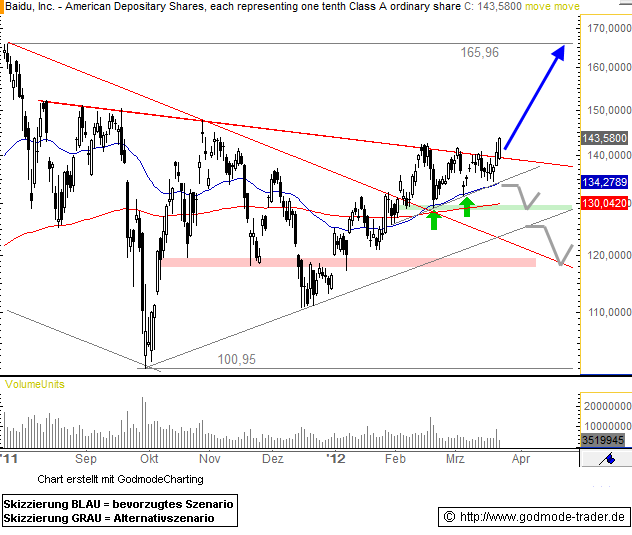 |
S | 130.79 |
02/02/12 | BoGo | |||||
| 03/22/12 | KO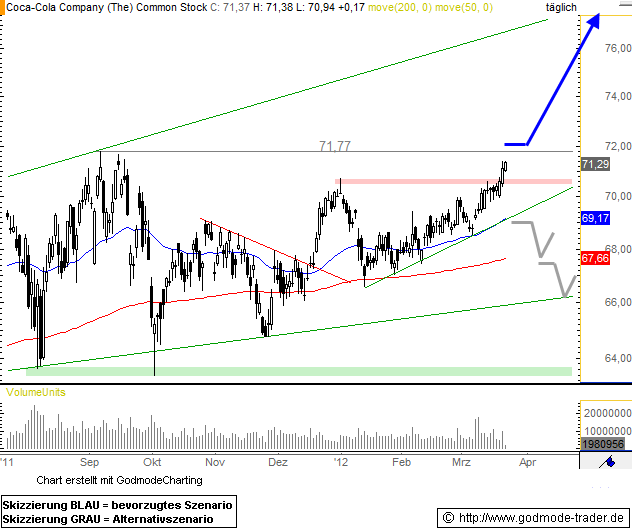 |
S | 67.83 |
02/02/12 | BoGo | |||||
| 03/22/12 | SHLD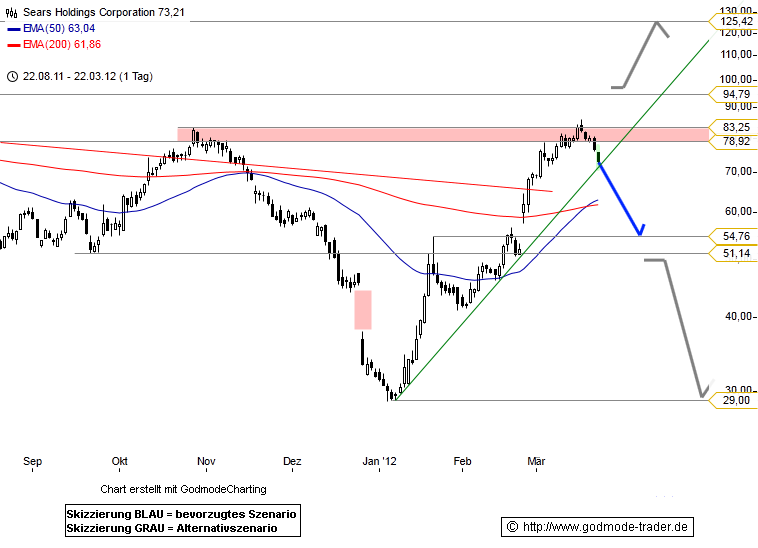 |
S | 41.97 |
02/02/12 | BoGo | |||||
| 03/21/12 | AMZN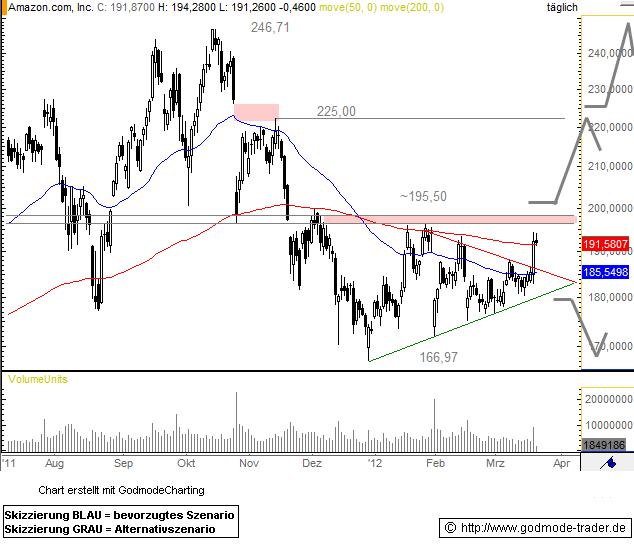 |
S | 181.72 |
02/02/12 | BoGo | |||||
| 03/21/12 | ORCL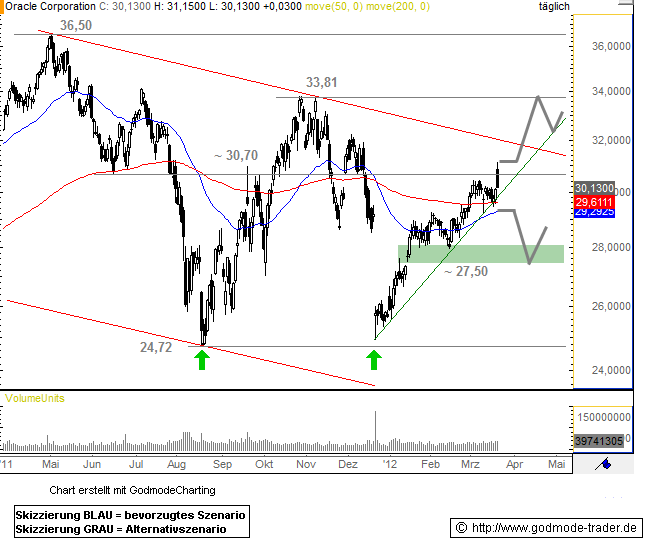 |
S | 28.81 |
02/02/12 | BoGo | |||||
| 03/21/12 | KFT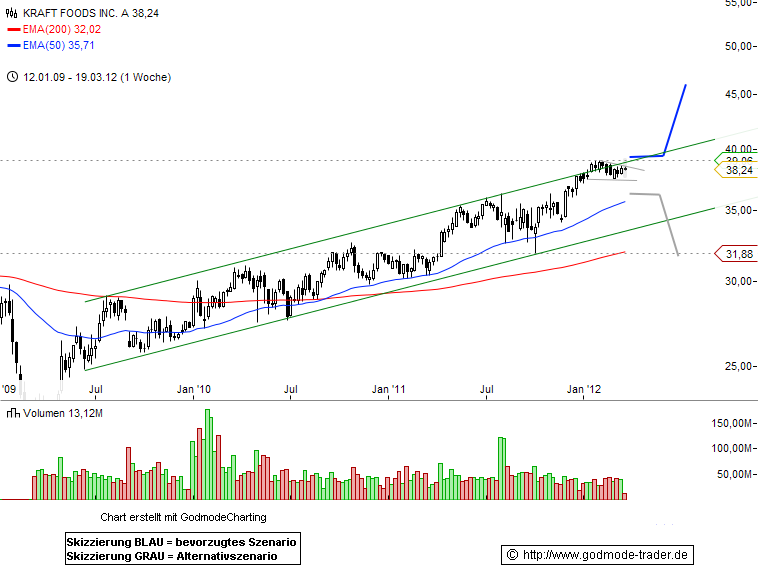 |
S | 38.58 |
02/02/12 | BoGo | |||||
| 03/21/12 | AXP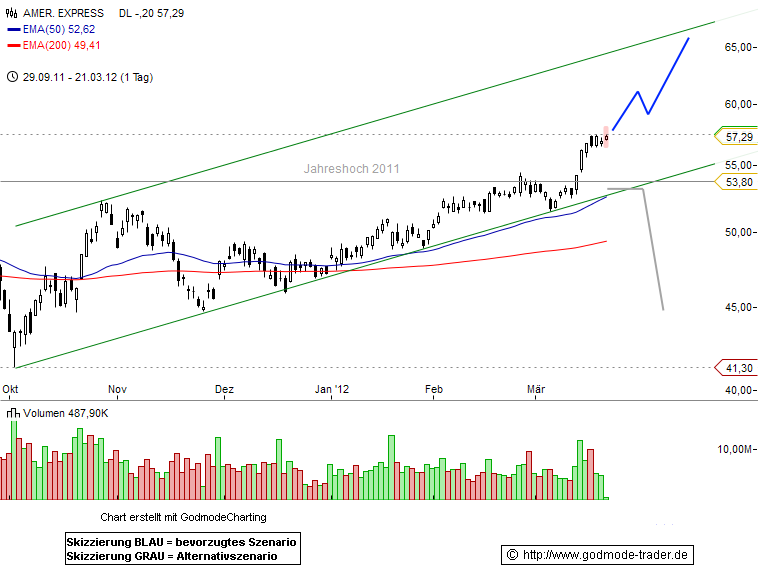 |
S | 51.16 |
02/02/12 | BoGo | |||||
| 03/21/12 | CSCO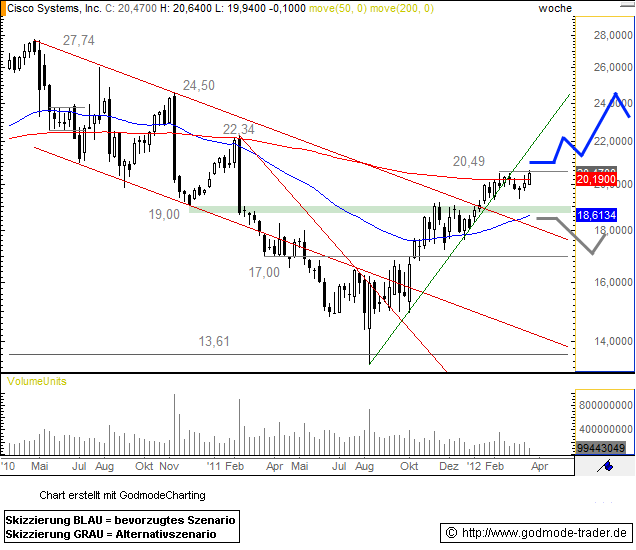 |
S | 19.80 |
02/02/12 | BoGo | |||||
| 03/20/12 | INTC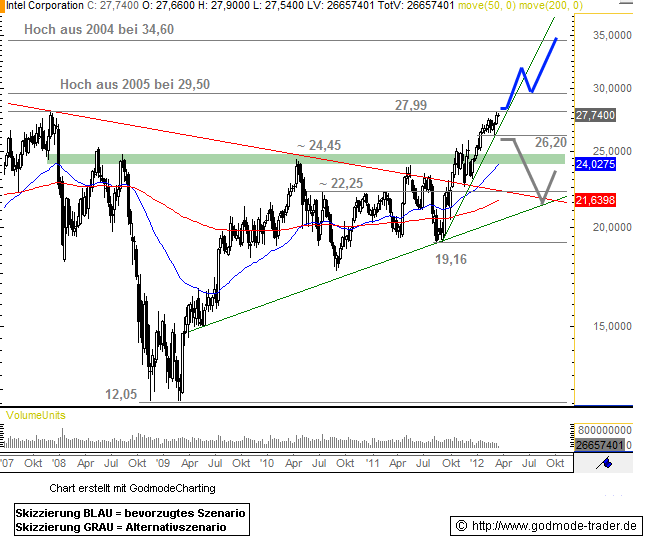 |
S | 26.49 |
02/02/12 | BoGo | |||||
| 03/20/12 | DD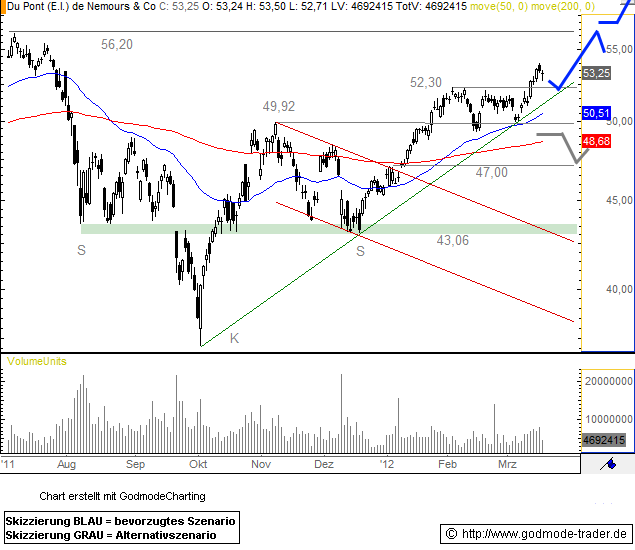 |
S | 51.40 |
02/02/12 | BoGo | |||||
| 03/20/12 | YHOO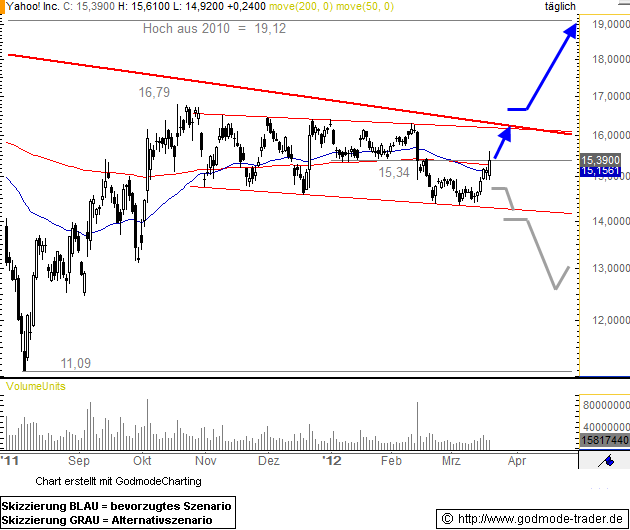 |
S | 15.72 |
02/02/12 | BoGo | |||||
| 03/19/12 | PCLN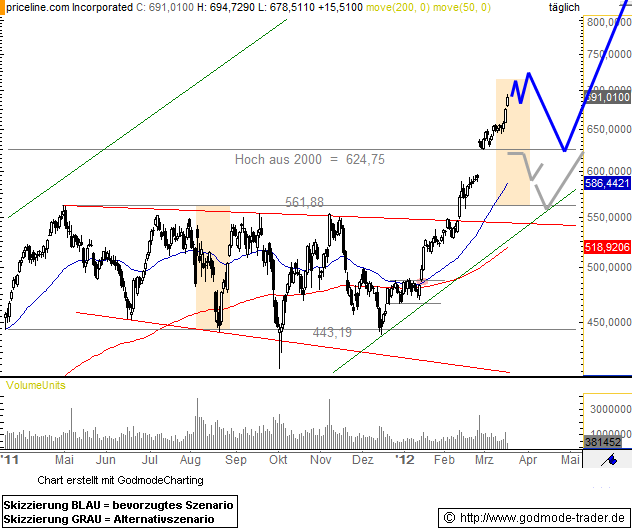 |
S | 533.83 |
02/02/12 | BoGo | |||||
| 03/19/12 | HPQ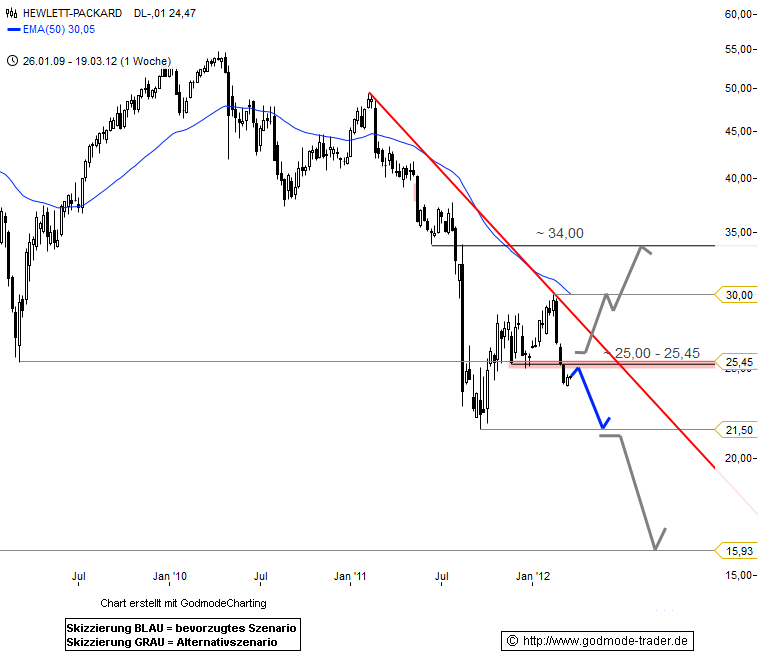 |
S | 28.50 |
02/02/12 | BoGo | |||||
| 03/19/12 | COST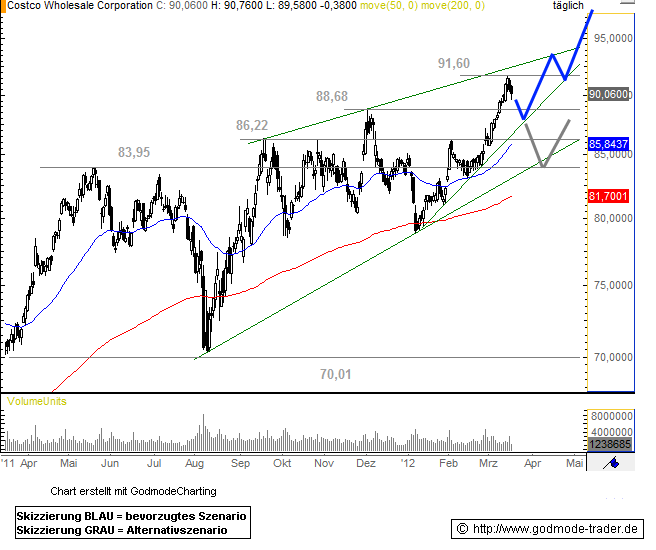 |
S | 85.51 |
02/02/12 | BoGo | |||||
| 03/19/12 | JPM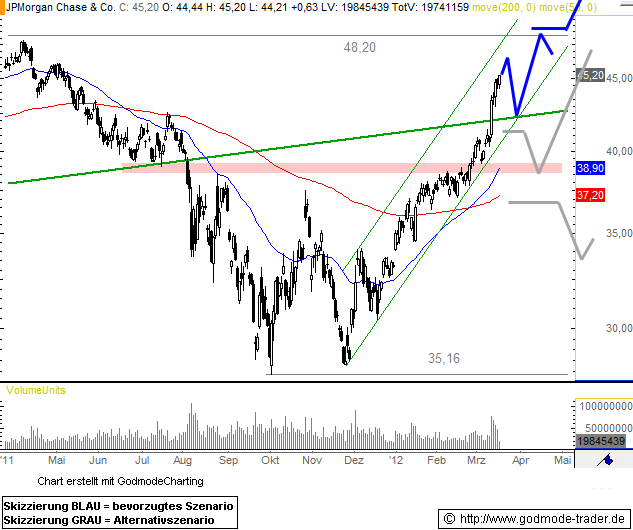 |
S | 37.55 |
02/02/12 | BoGo | |||||
| 03/19/12 | FSLR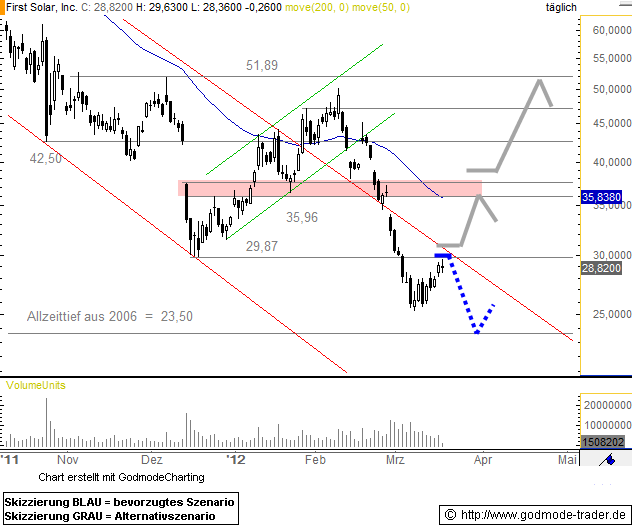 |
S | 44.74 |
02/02/12 | BoGo | |||||
| 03/16/12 | MCD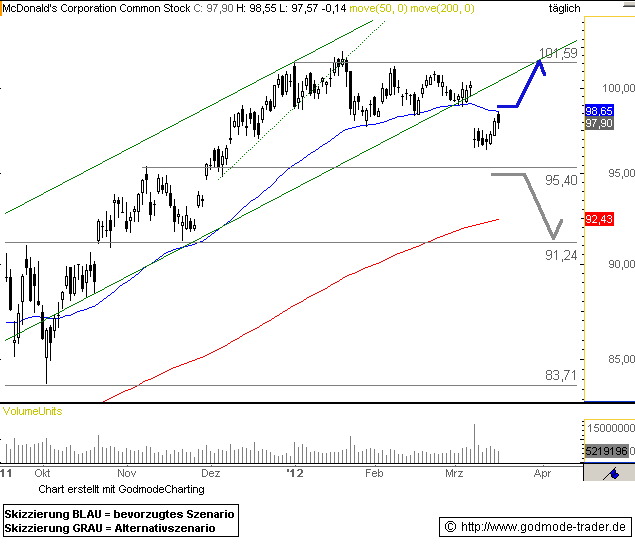 |
S | 98.62 |
02/02/12 | BoGo | |||||
| 03/16/12 | AMGN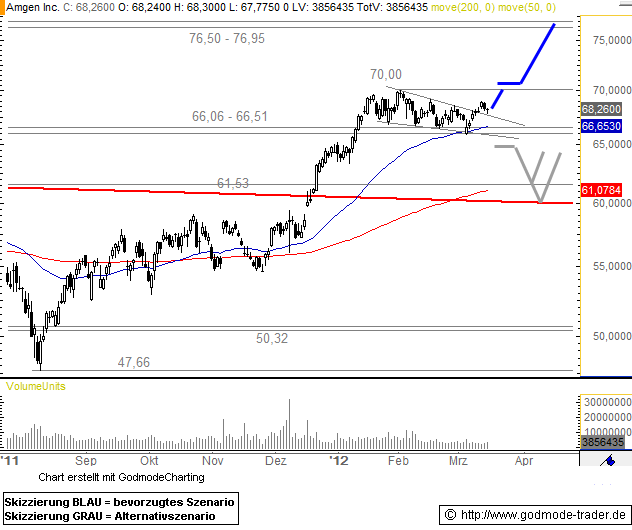 |
S | 69.62 |
02/02/12 | BoGo | |||||
| 03/16/12 | RIMM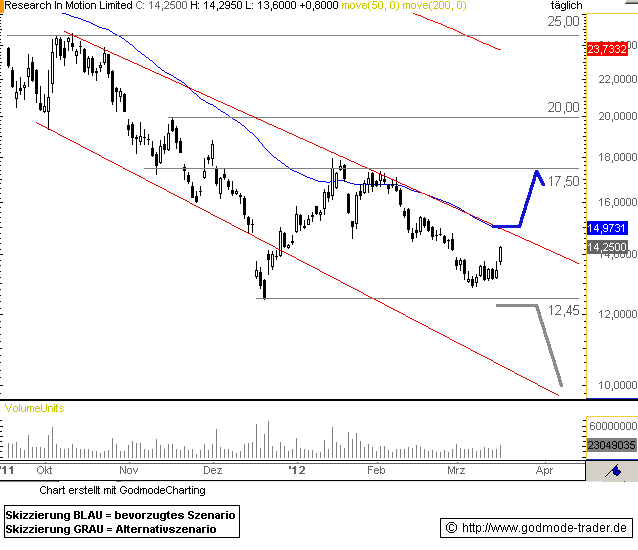 |
S | 17.21 |
02/02/12 | BoGo | |||||
| 03/16/12 | SBUX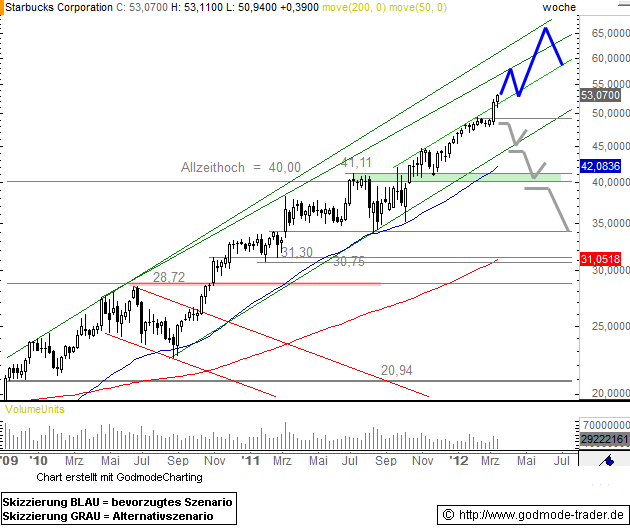 |
S | 47.66 |
02/02/12 | BoGo | |||||
| 03/16/12 | PFE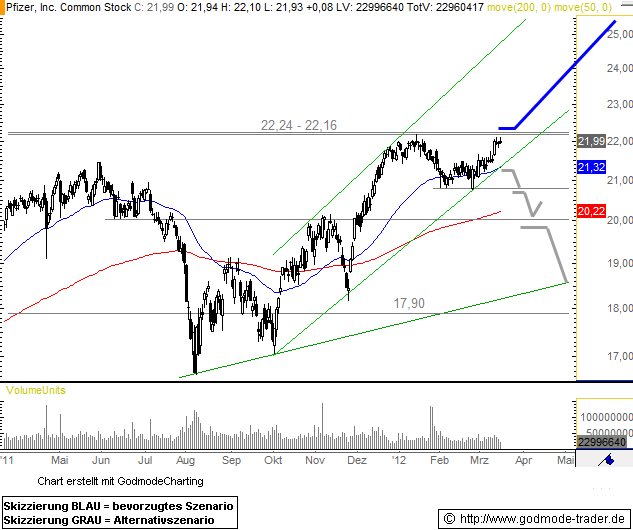 |
S | 21.11 |
02/02/12 | BoGo | |||||
| 03/15/12 | BAC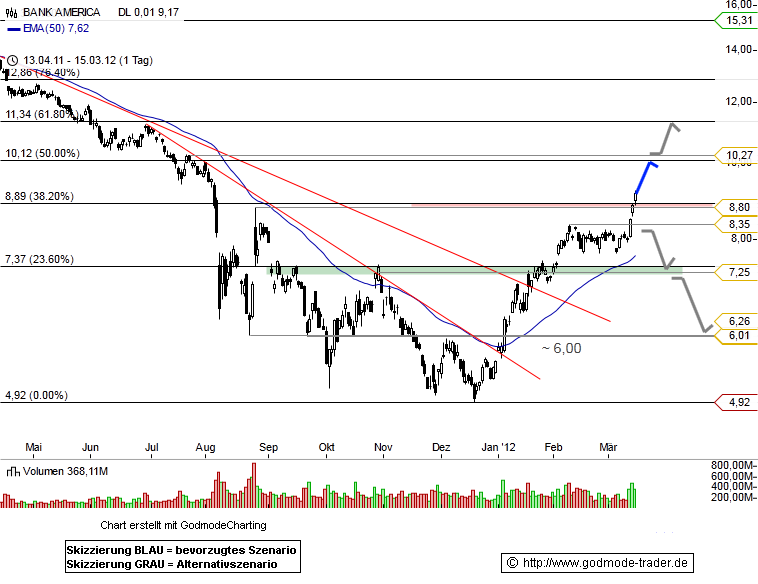 |
S | 7.45 |
02/02/12 | BoGo | |||||
| 03/14/12 | T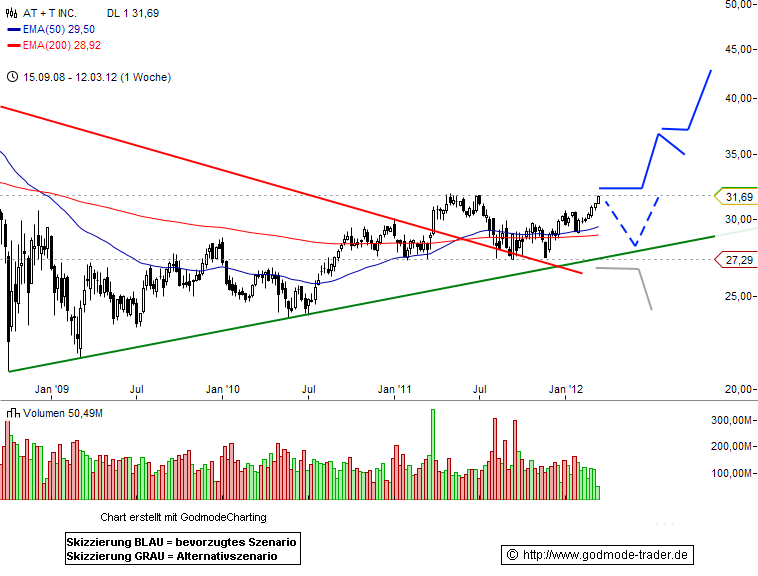 |
S | 29.79 |
02/02/12 | BoGo | |||||
| 03/14/12 | TRV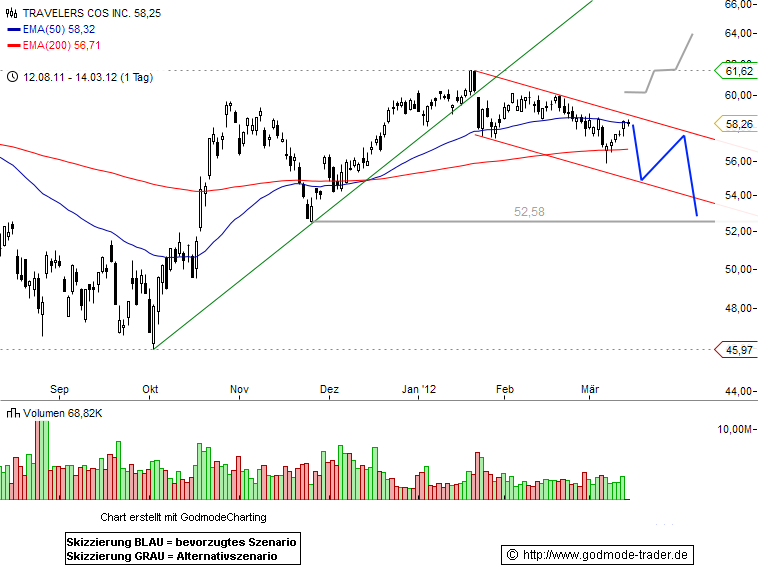 |
S | 59.39 |
02/02/12 | BoGo | |||||
| 03/14/12 | AAPL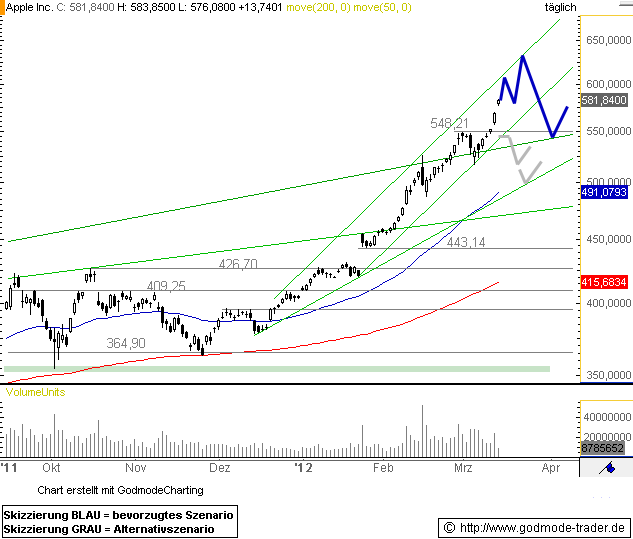 |
S | 455.12 |
02/02/12 | BoGo | |||||
| 03/14/12 | EBAY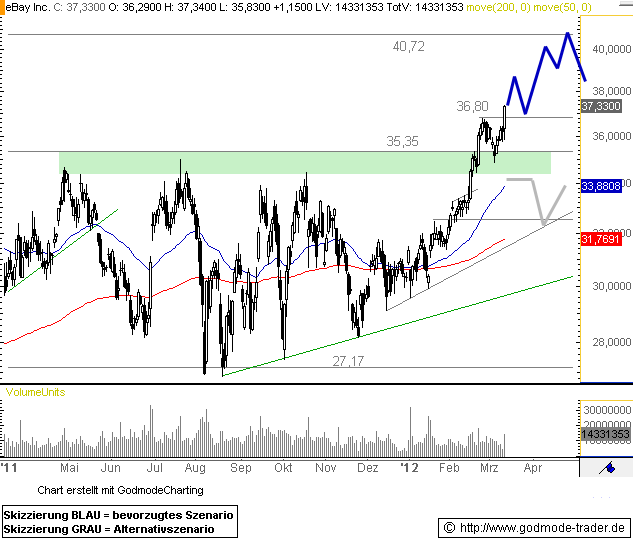 |
S | 32.70 |
02/02/12 | BoGo | |||||
| 03/13/12 | X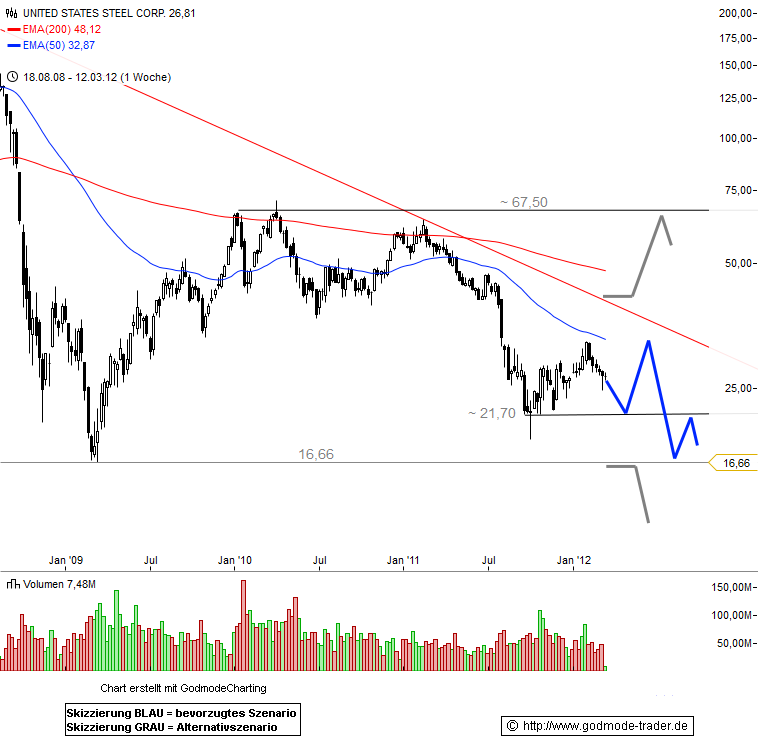 |
S | 31.44 |
02/02/12 | BoGo | |||||
| 03/13/12 | AA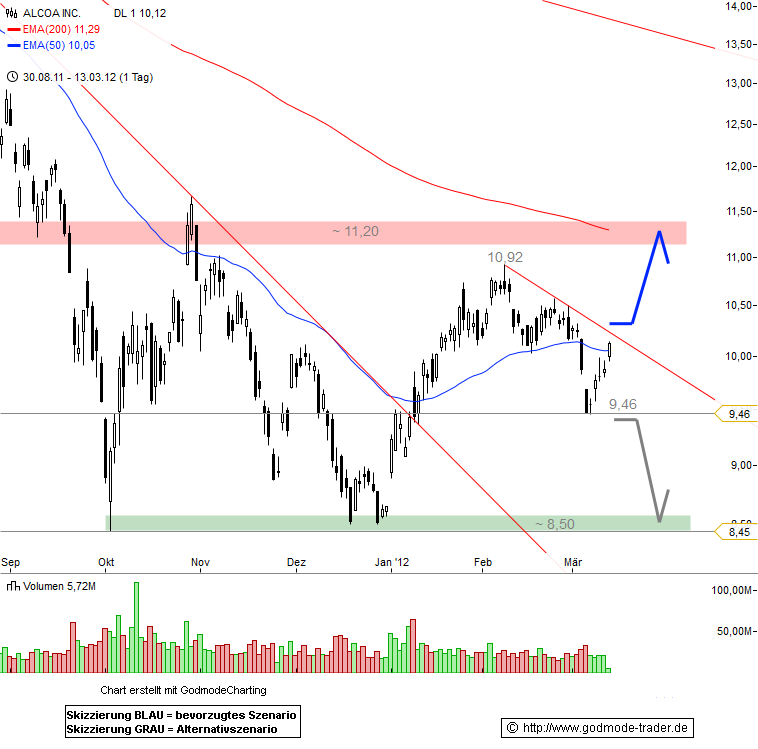 |
S | 10.42 |
02/02/12 | BoGo | |||||
| 03/13/12 | MSFT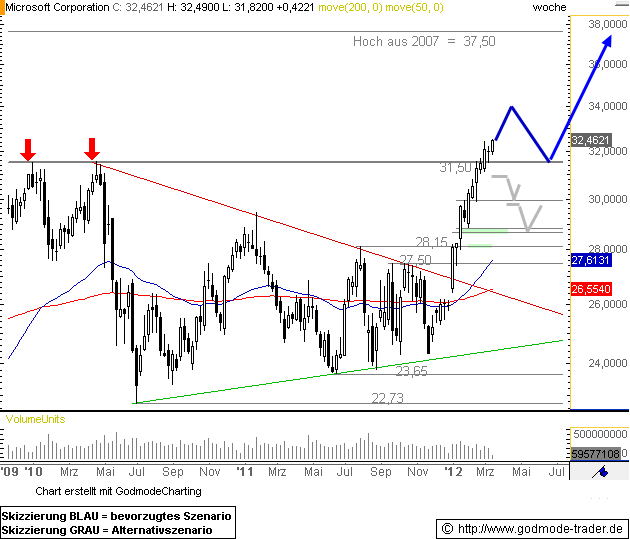 |
S | 29.95 |
02/02/12 | BoGo | |||||
| 03/13/12 | IBM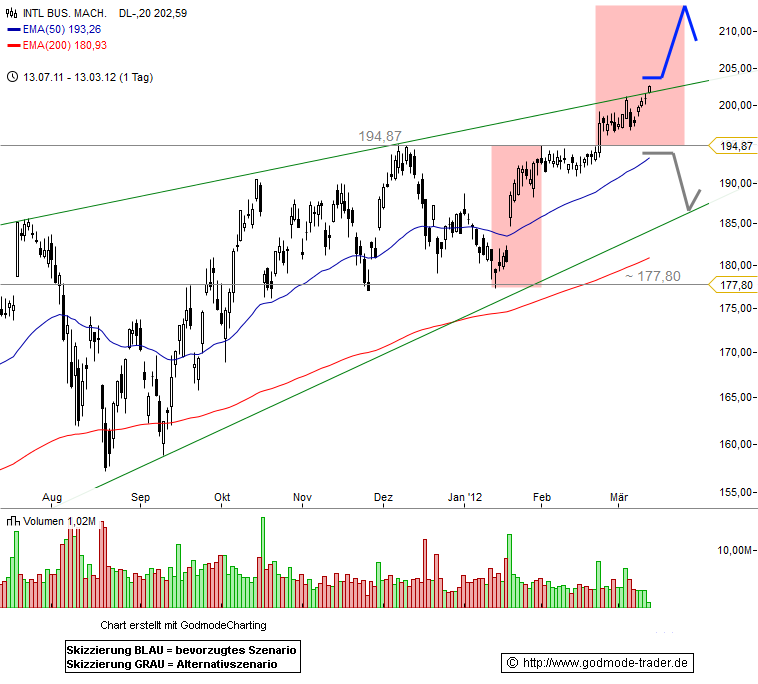 |
S | 191.53 |
02/02/12 | BoGo | |||||
| 03/12/12 | BIDU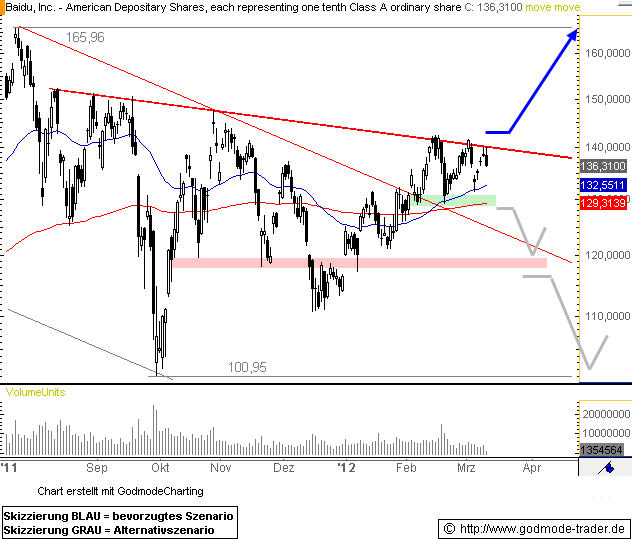 |
S | 130.79 |
02/02/12 | BoGo | |||||
| 03/12/12 | INTC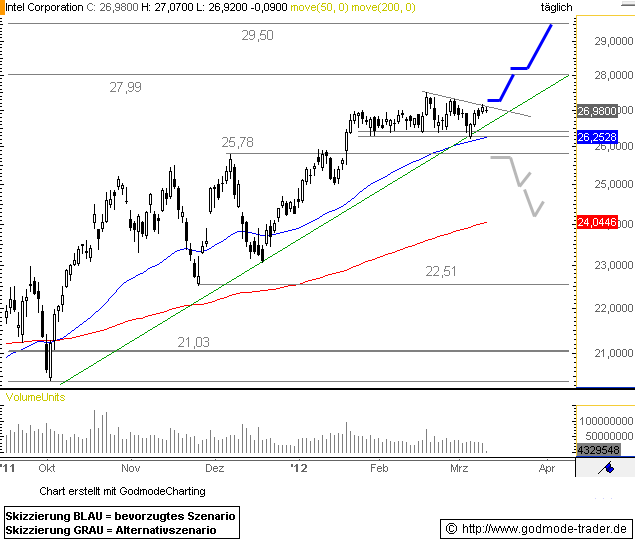 |
S | 26.49 |
02/02/12 | BoGo | |||||
| 03/12/12 | ORCL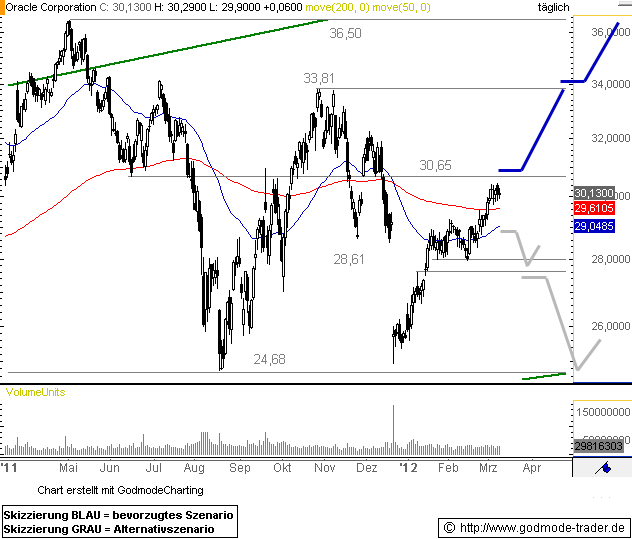 |
S | 28.81 |
02/02/12 | BoGo | |||||
| 03/09/12 | MRK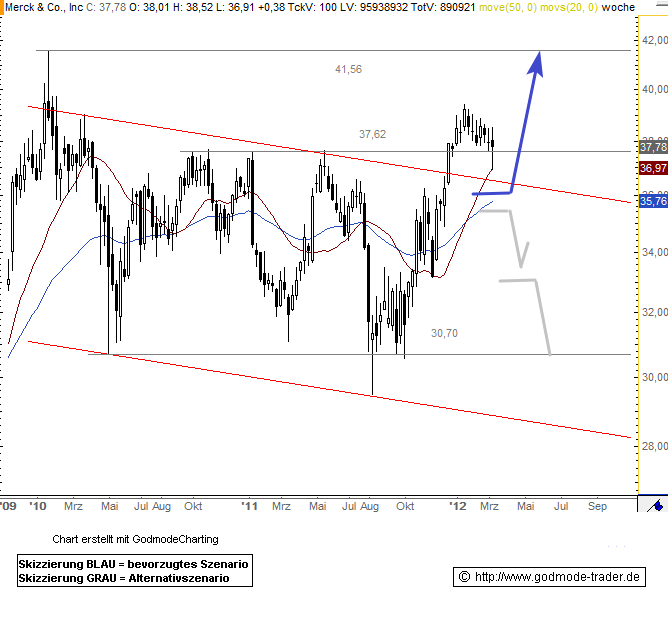 |
S | 38.44 |
02/02/12 | BoGo | |||||
| 03/09/12 | JPM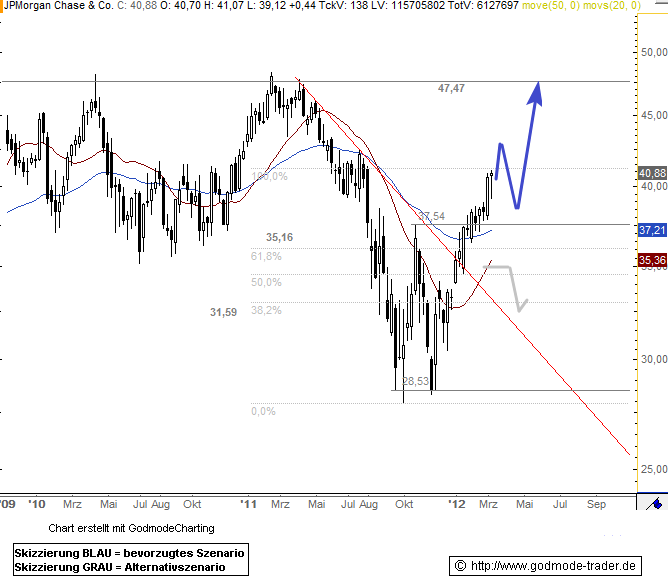 |
S | 37.55 |
02/02/12 | BoGo | |||||
| 03/09/12 | EXPE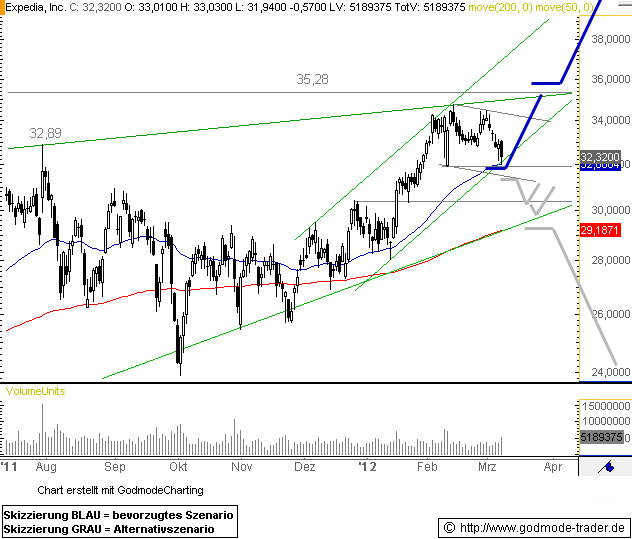 |
S | 33.02 |
02/02/12 | BoGo | |||||
| 03/08/12 | XOM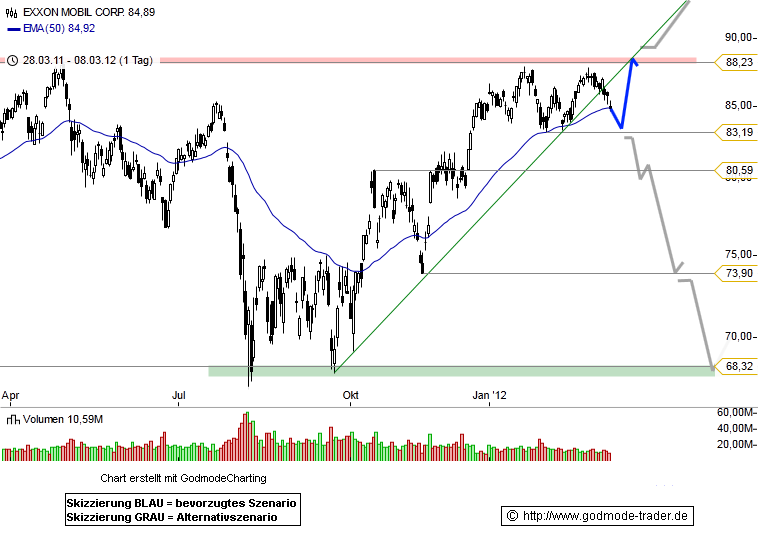 |
S | 83.53 |
02/02/12 | BoGo | |||||
| 03/08/12 | SBUX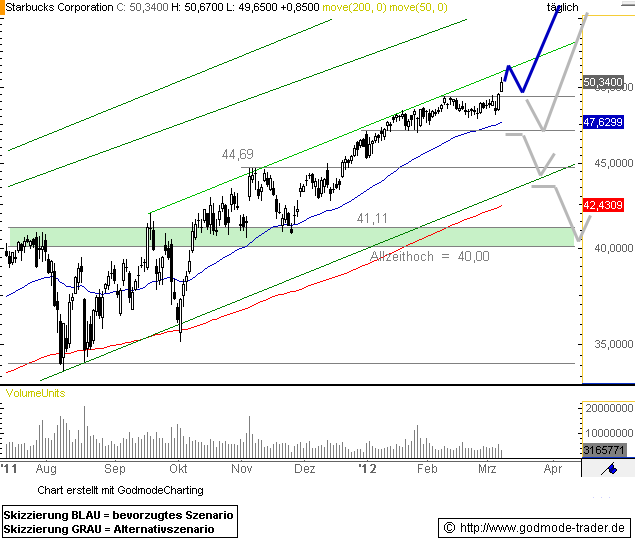 |
S | 47.66 |
02/02/12 | BoGo | |||||
| 03/08/12 | SHLD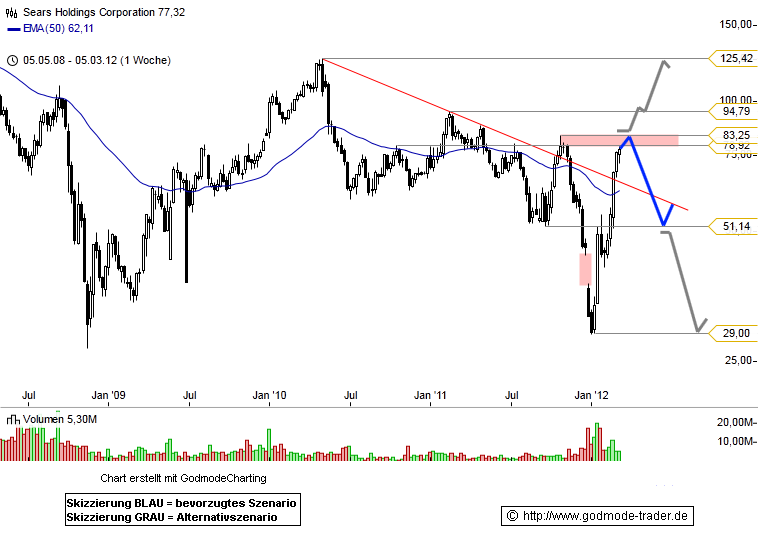 |
S | 41.97 |
02/02/12 | BoGo | |||||
| 03/08/12 | ADBE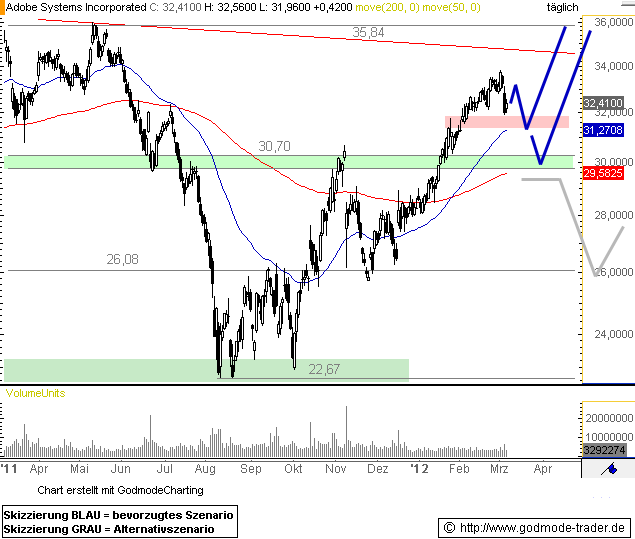 |
S | 31.29 |
02/02/12 | BoGo | |||||
| 03/07/12 | F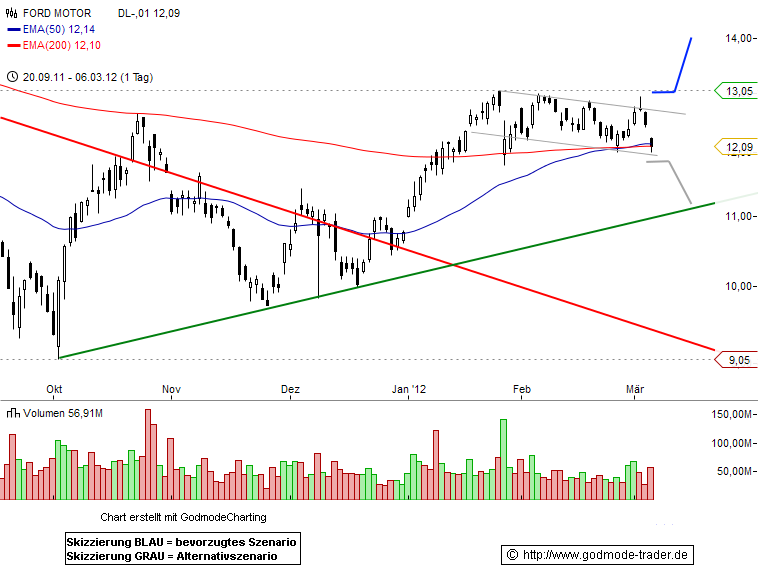 |
S | 12.26 |
02/02/12 | BoGo | |||||
| 03/07/12 | KO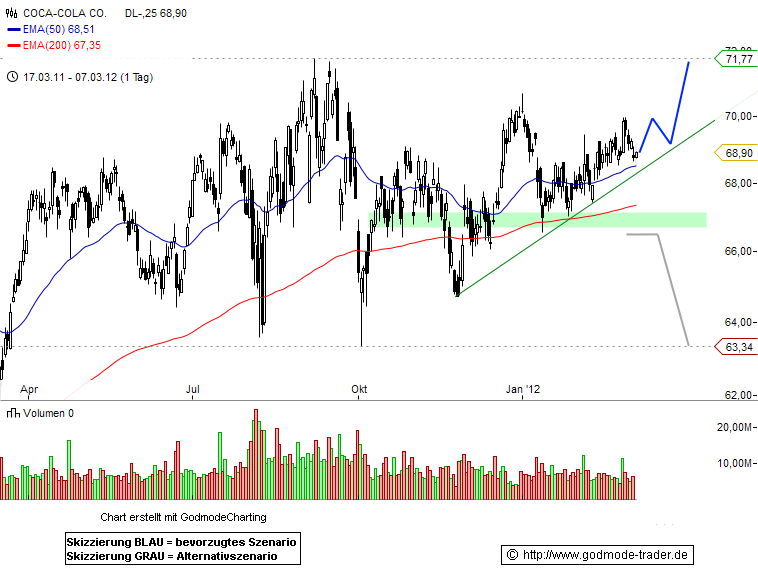 |
S | 67.83 |
02/02/12 | BoGo | |||||
| 03/07/12 | MMM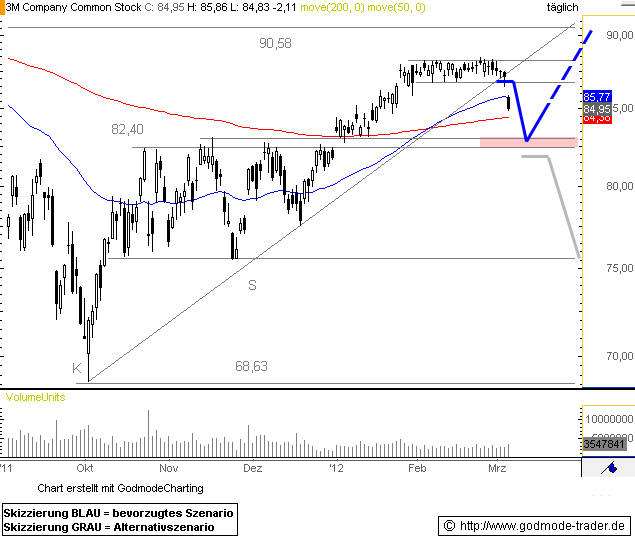 |
S | 87.43 |
02/02/12 | BoGo | |||||
| 03/07/12 | EBAY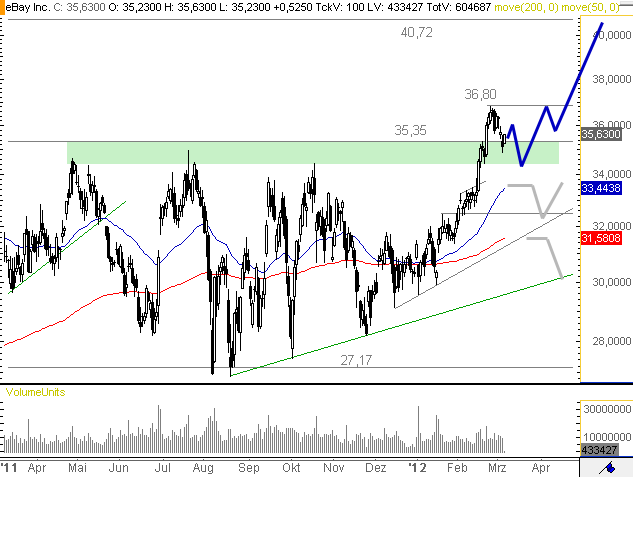 |
S | 32.70 |
02/02/12 | BoGo | |||||
| 03/06/12 | DIS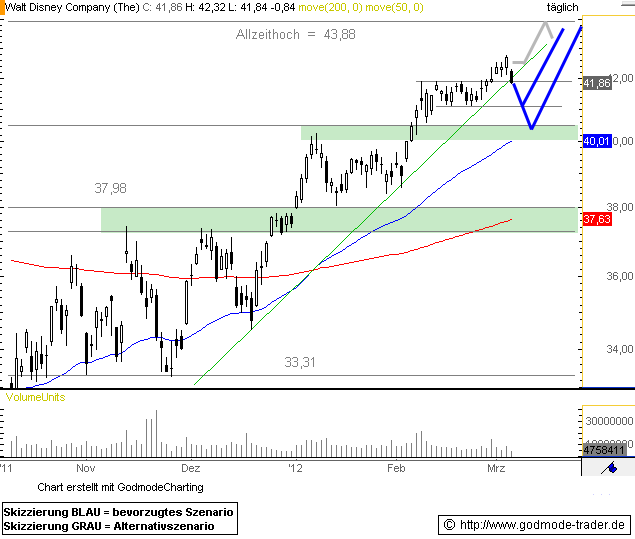 |
S | 38.91 |
02/02/12 | BoGo | |||||
| 03/06/12 | SPY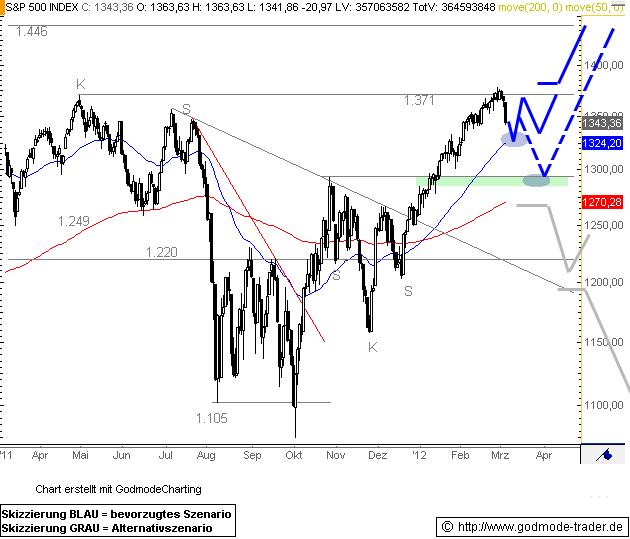 |
S | 132.68 |
02/02/12 | BoGo | |||||
| 03/06/12 | AAPL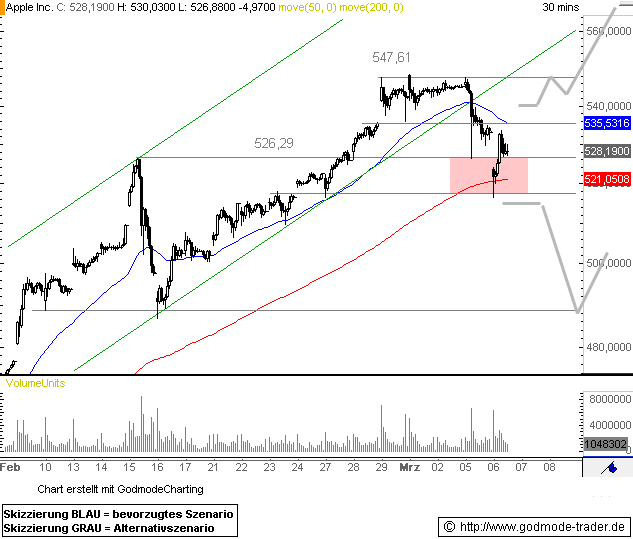 |
S | 455.12 |
02/02/12 | BoGo | |||||
| 03/05/12 | COST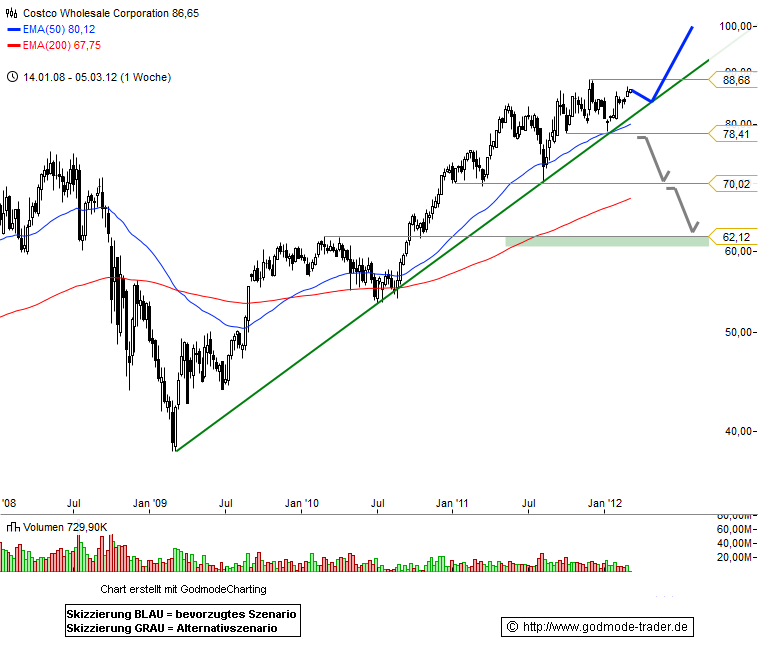 |
S | 85.51 |
02/02/12 | BoGo | |||||
| 03/05/12 | FSLR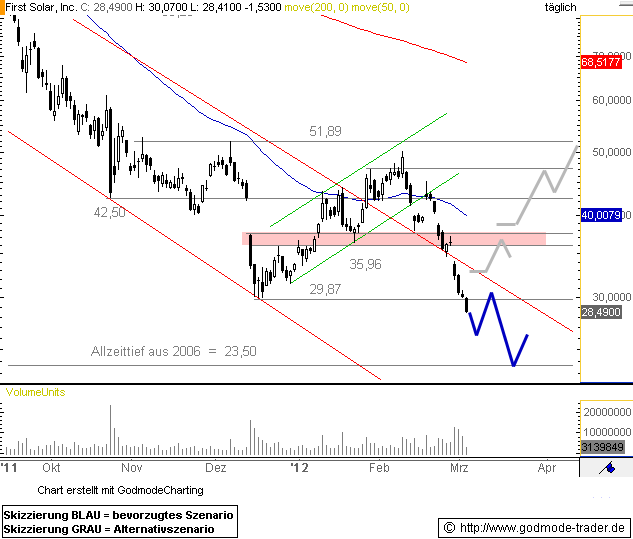 |
S | 44.74 |
02/02/12 | BoGo | |||||
| 03/05/12 | MCD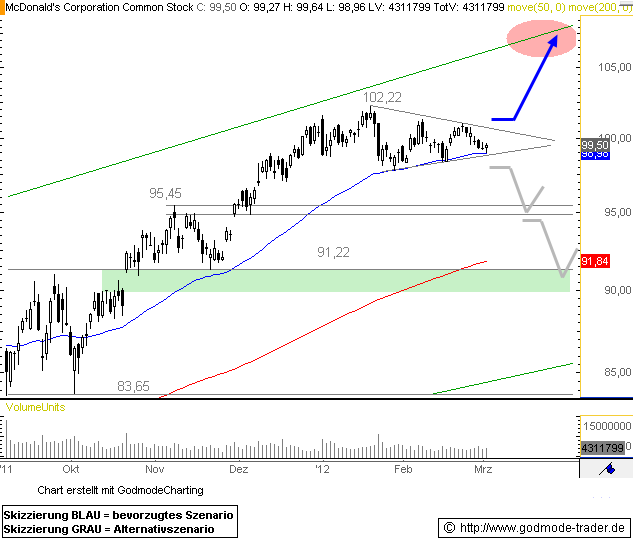 |
S | 98.62 |
02/02/12 | BoGo | |||||
| 03/02/12 | EBAY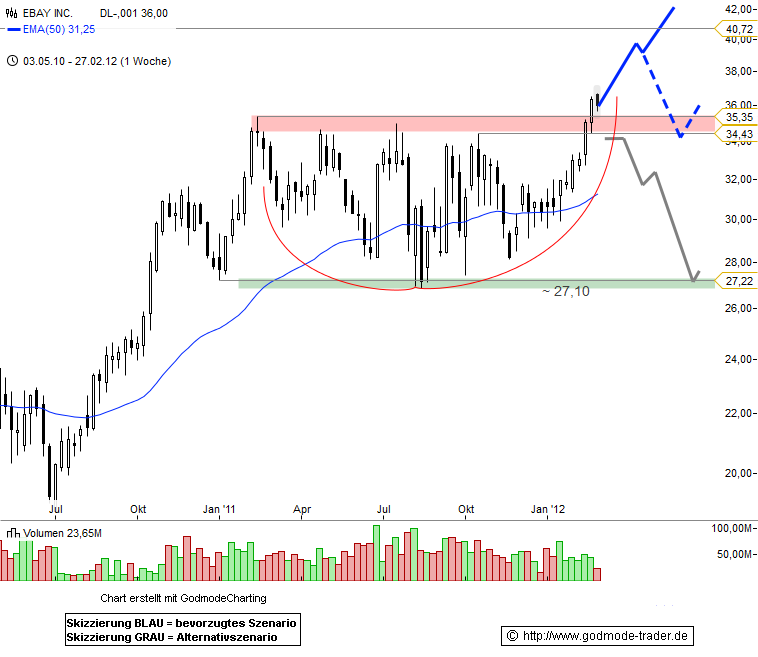 |
S | 32.70 |
02/02/12 | BoGo | |||||
| 03/02/12 | KFT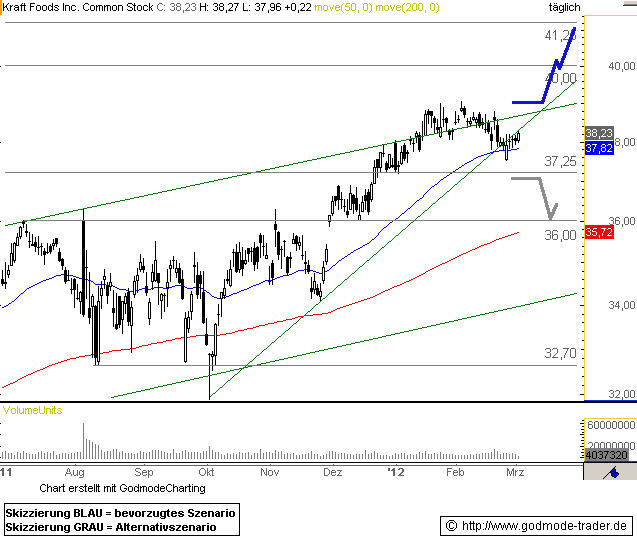 |
S | 38.58 |
02/02/12 | BoGo | |||||
| 03/02/12 | NVDA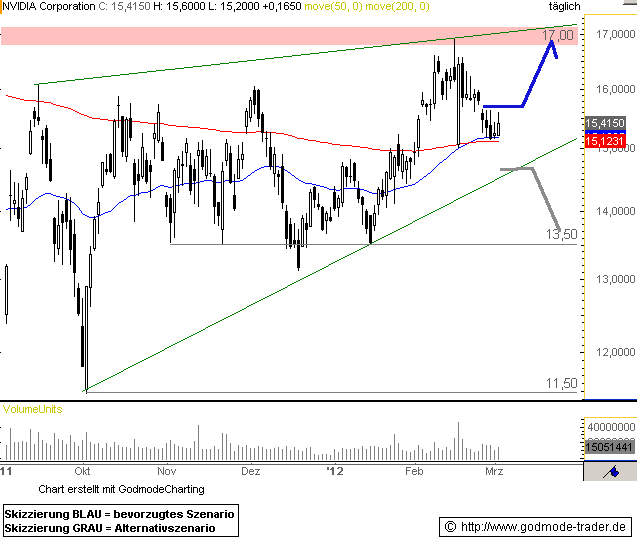 |
S | 15.49 |
02/02/12 | BoGo | |||||
| 03/02/12 | RIMM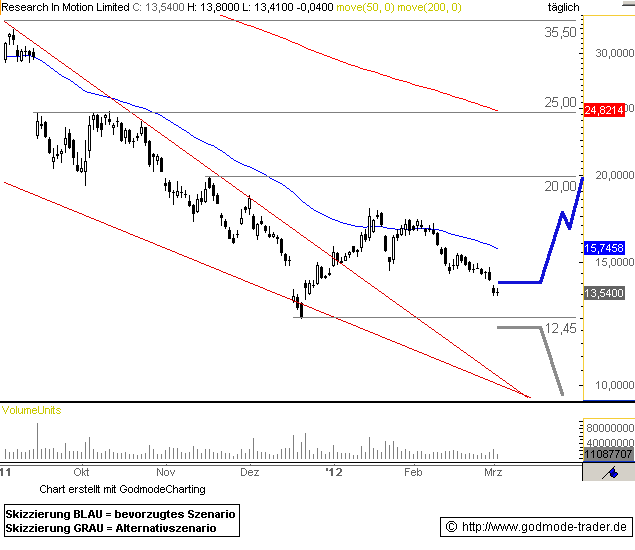 |
S | 17.21 |
02/02/12 | BoGo | |||||
| 03/02/12 | PFE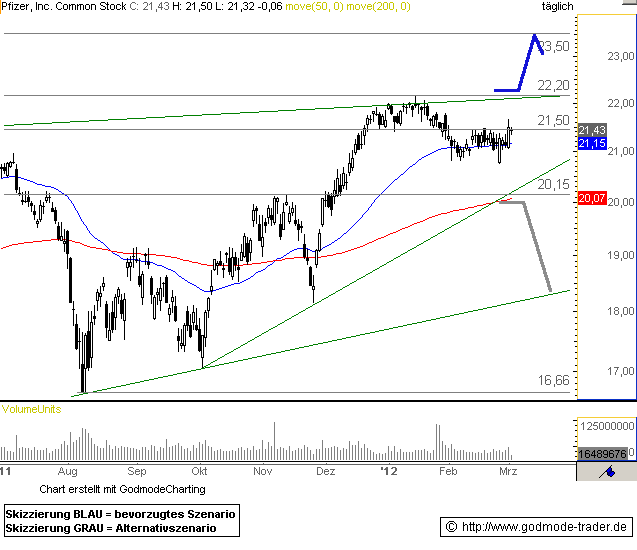 |
S | 21.11 |
02/02/12 | BoGo | |||||
| 03/01/12 | ORCL |
S | 28.81 |
02/02/12 | BoGo | |||||
| 03/01/12 | BAC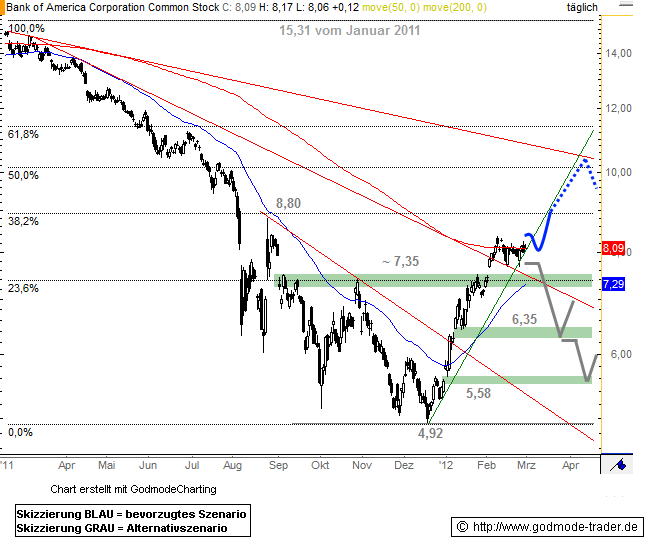 |
S | 7.45 |
02/02/12 | BoGo | |||||
| 03/01/12 | FSLR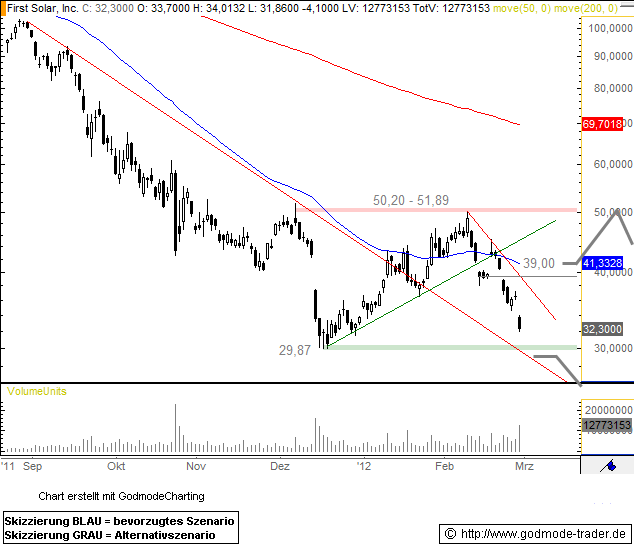 |
S | 44.74 |
02/02/12 | BoGo | |||||
| 02/29/12 | CSCO |
S | 19.80 |
02/02/12 | BoGo | |||||
| 02/29/12 | ADBE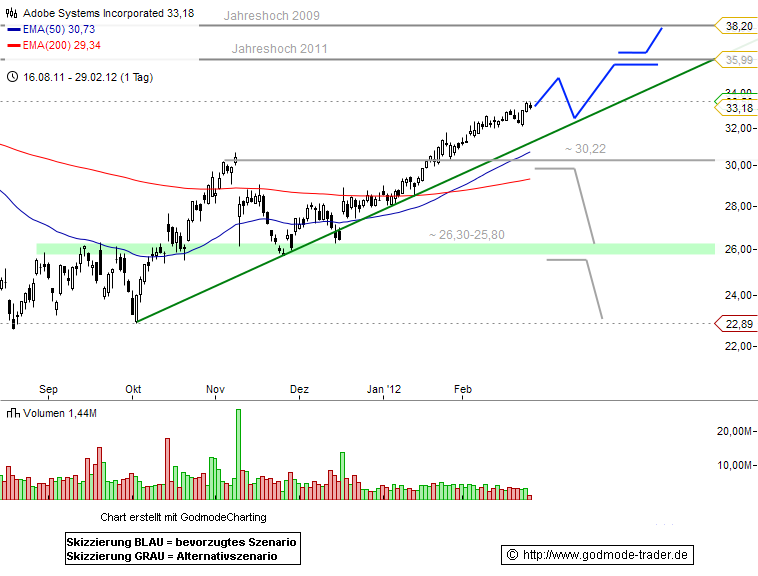 |
S | 31.29 |
02/02/12 | BoGo | |||||
| 02/29/12 | BA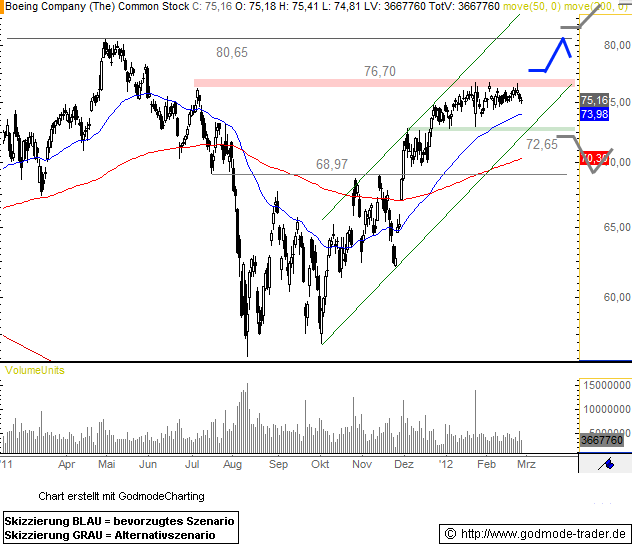 |
S | 75.22 |
02/02/12 | BoGo | |||||
| 02/28/12 | IBM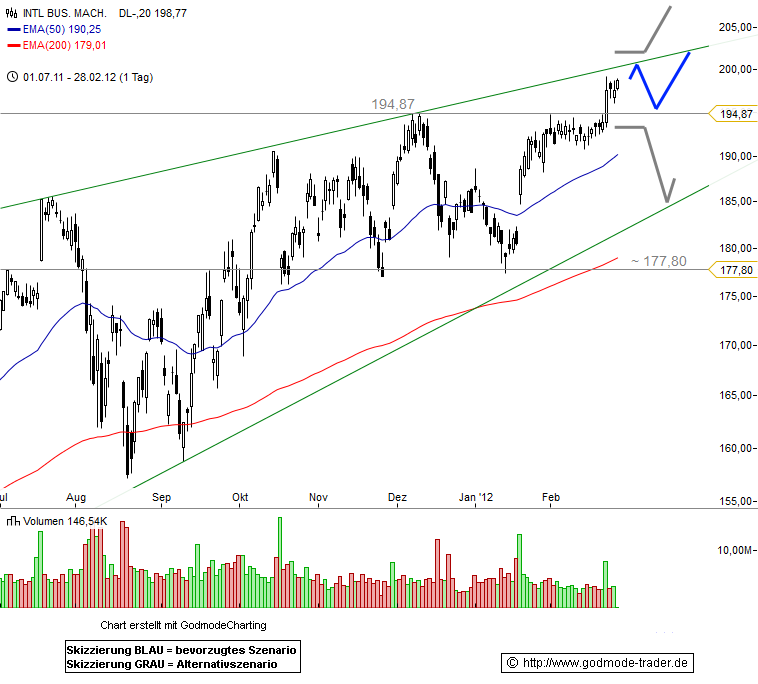 |
S | 191.53 |
02/02/12 | BoGo | |||||
| 02/28/12 | CVX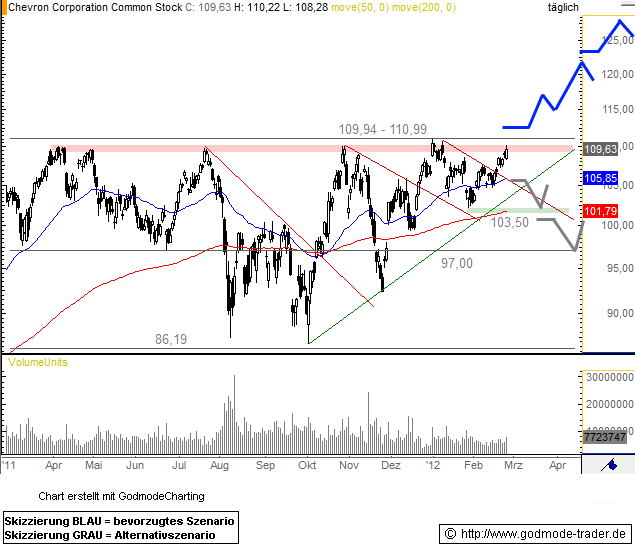 |
S | 103.69 |
02/02/12 | BoGo | |||||
| 02/28/12 | QCOM |
S | 60.73 |
02/02/12 | BoGo | |||||
| 02/27/12 | RIMM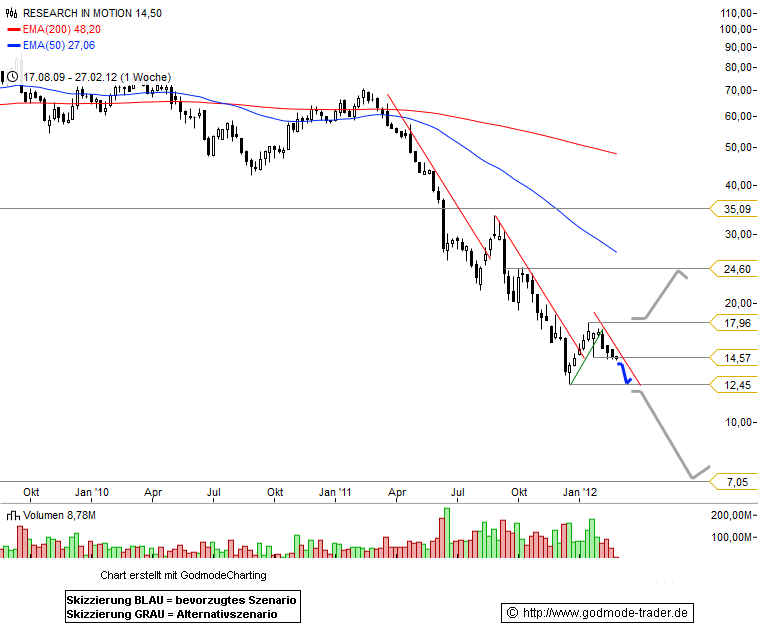 |
S | 17.21 |
02/02/12 | BoGo | |||||
| 02/27/12 | AXP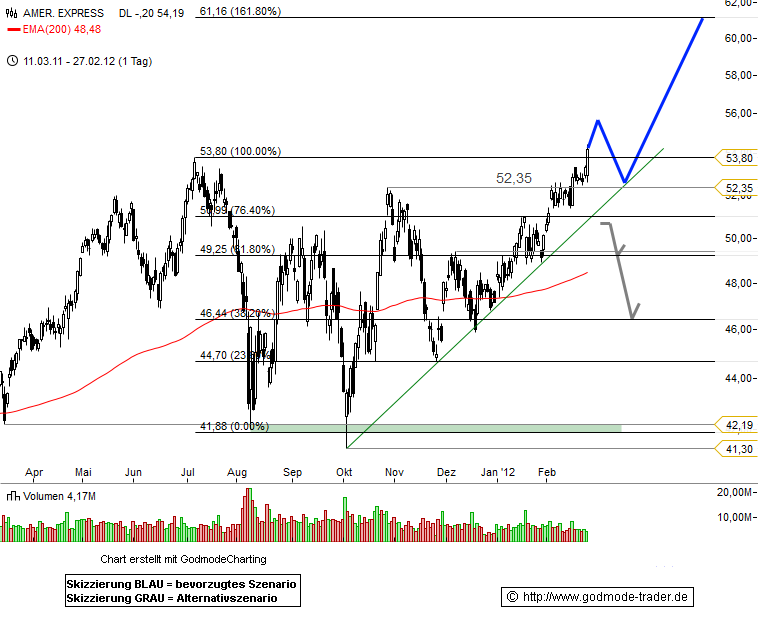 |
S | 51.16 |
02/02/12 | BoGo | |||||
| 02/27/12 | DELL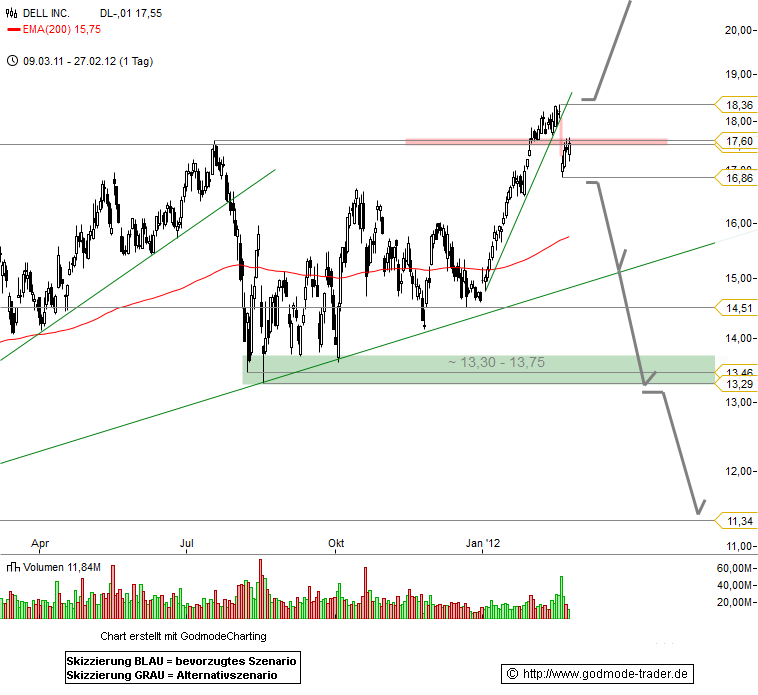 |
S | 17.60 |
02/02/12 | BoGo | |||||
| 02/24/12 | AMGN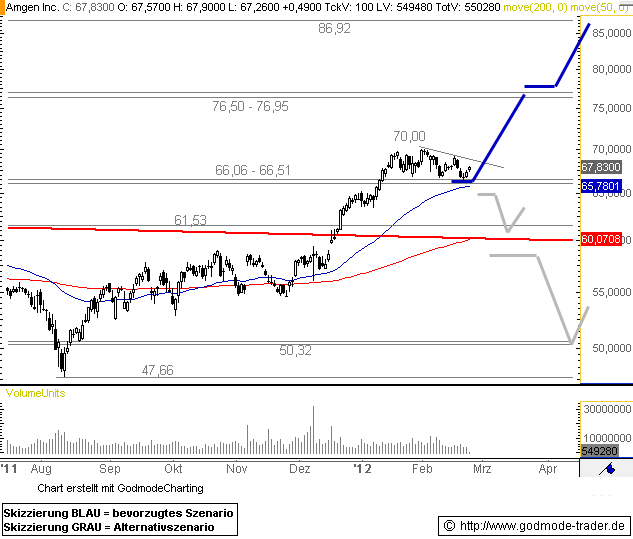 |
S | 69.62 |
02/02/12 | BoGo | |||||
| 02/24/12 | VZ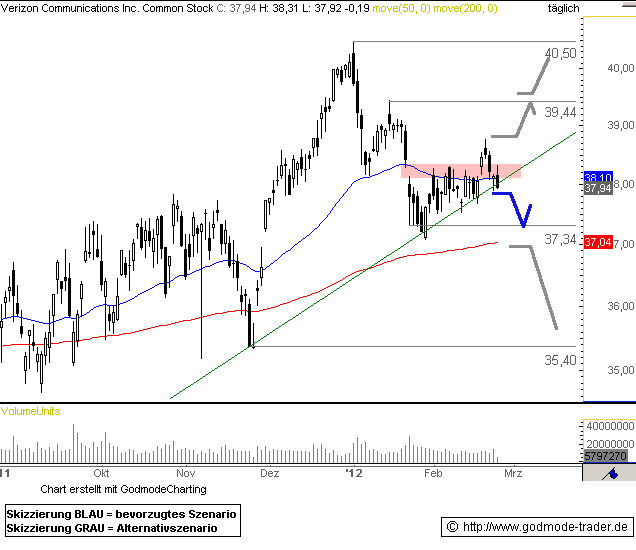 |
S | 37.56 |
02/02/12 | BoGo | |||||
| 02/24/12 | MRK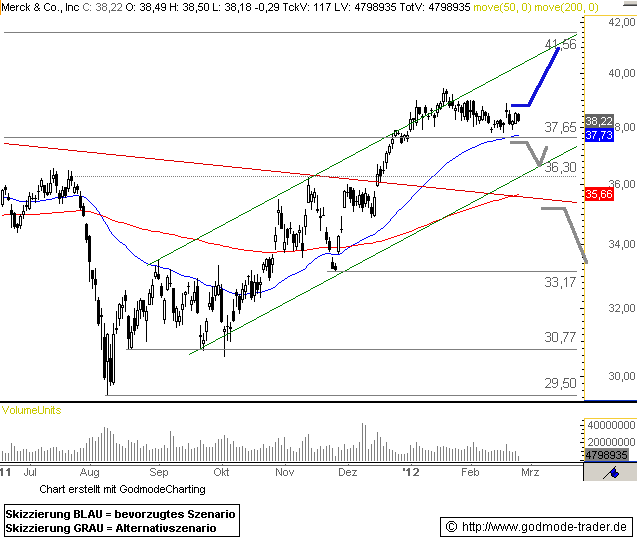 |
S | 38.44 |
02/02/12 | BoGo | |||||
| 02/24/12 | CSCO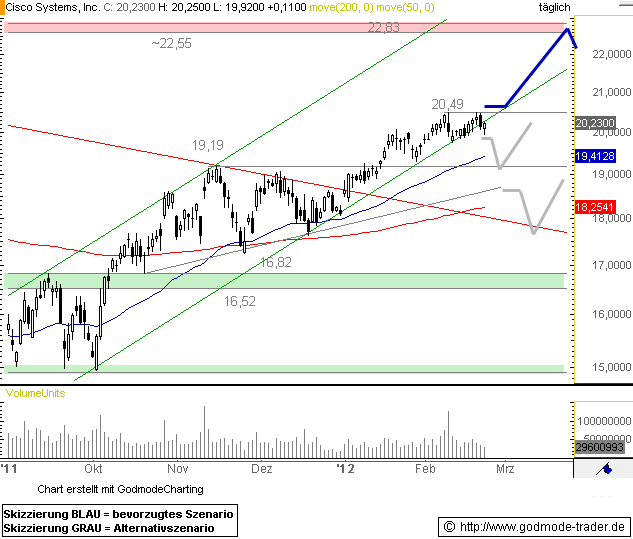 |
S | 19.80 |
02/02/12 | BoGo | |||||
| 02/24/12 | BIDU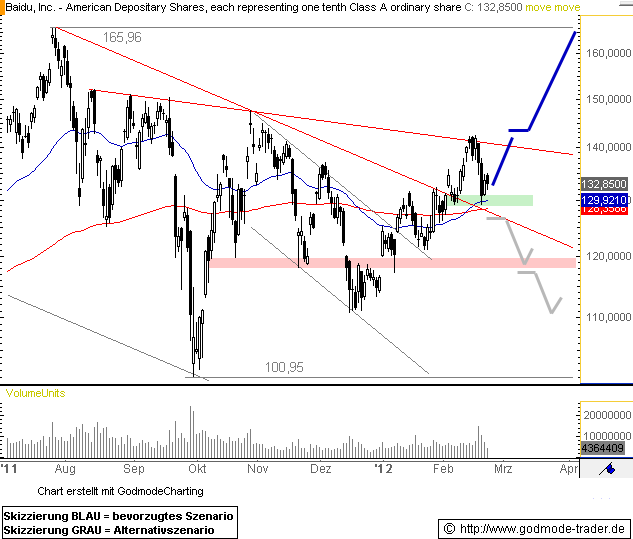 |
S | 130.79 |
02/02/12 | BoGo | |||||
| 02/24/12 | UUP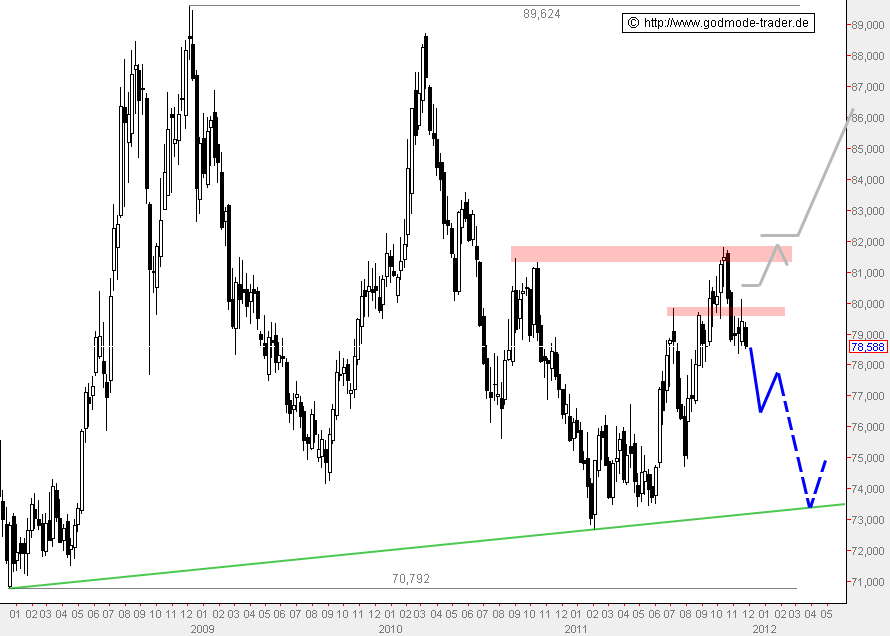 |
S | 22.03 |
02/02/12 | BoGo | |||||
| 02/23/12 | YHOO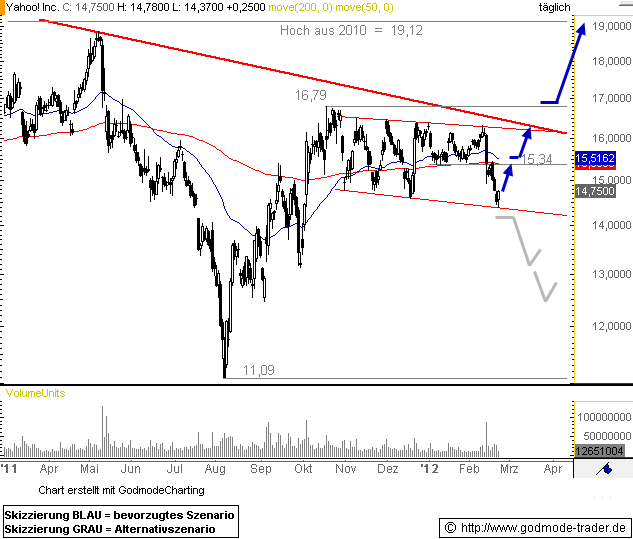 |
S | 15.72 |
02/02/12 | BoGo | |||||
| 02/23/12 | EBAY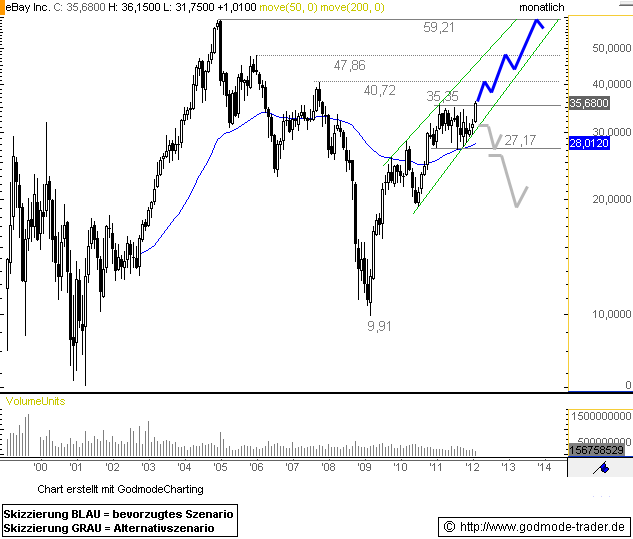 |
S | 32.70 |
02/02/12 | BoGo | |||||
| 02/23/12 | CMCSA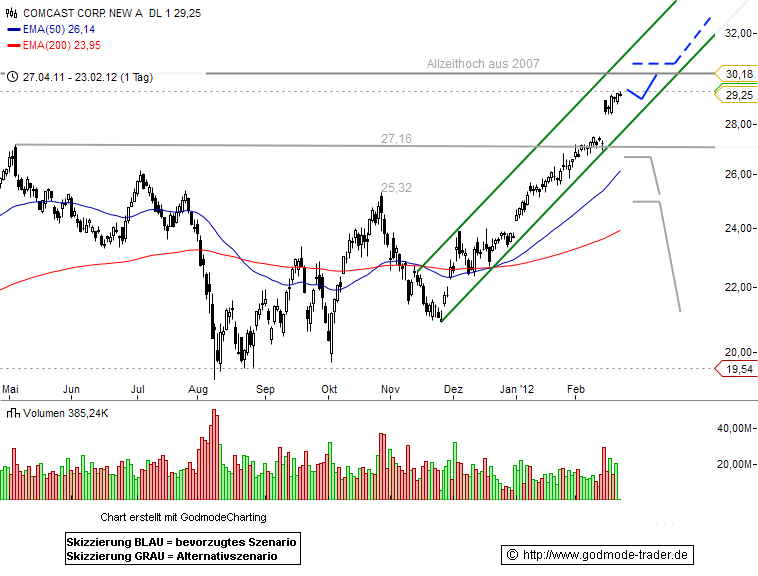 |
S | 26.69 |
02/02/12 | BoGo | |||||
| 02/23/12 | HPQ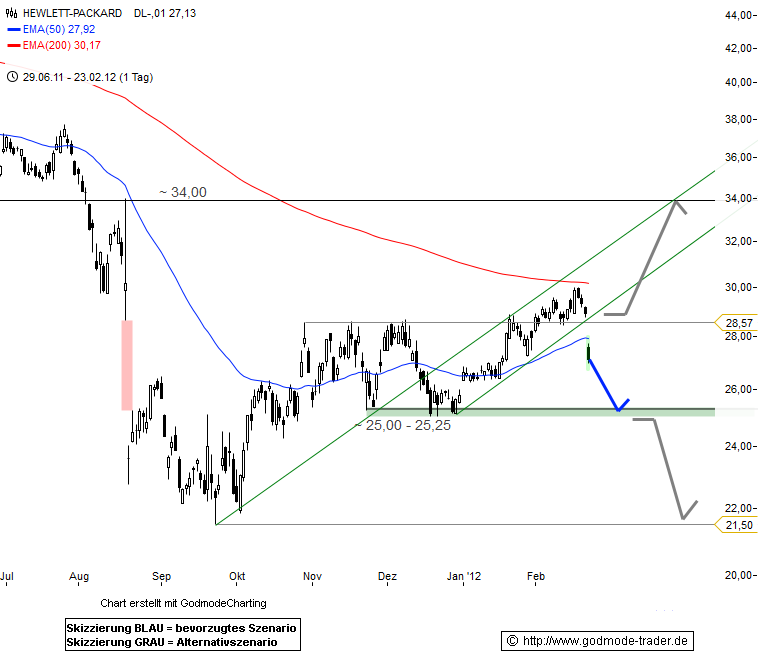 |
S | 28.50 |
02/02/12 | BoGo | |||||
| 02/22/12 | EBAY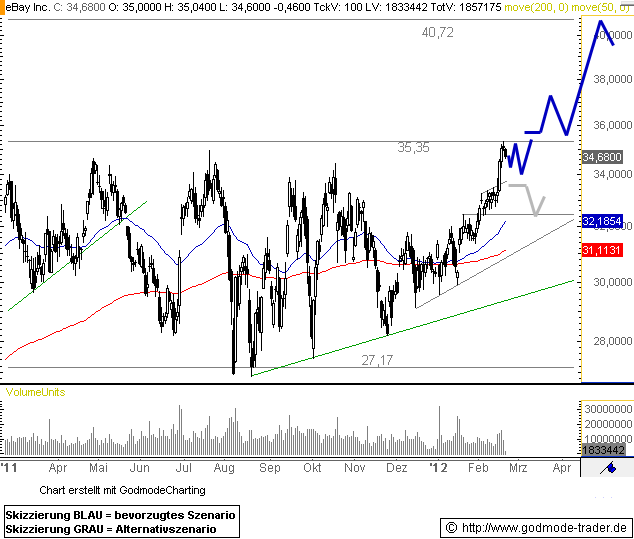 |
S | 32.70 |
02/02/12 | BoGo | |||||
| 02/22/12 | DELL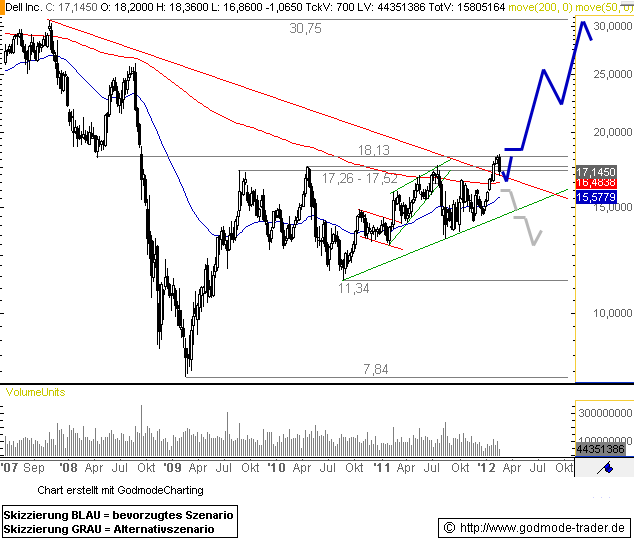 |
S | 17.60 |
02/02/12 | BoGo | |||||
| 02/22/12 | CAT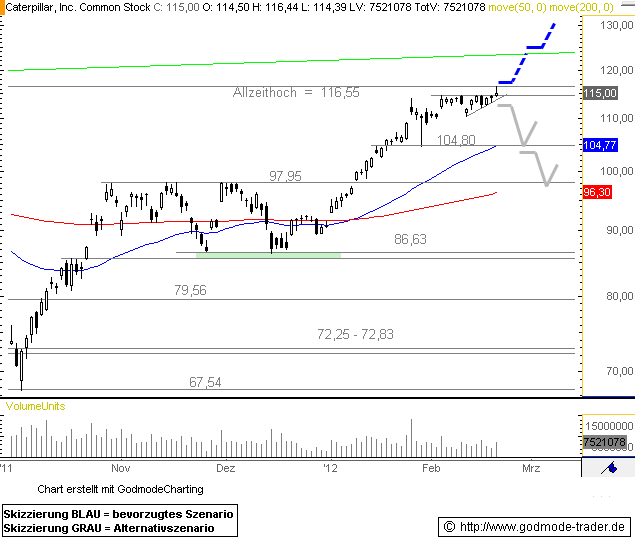 |
S | 110.33 |
02/02/12 | BoGo | |||||
| 02/22/12 | MMM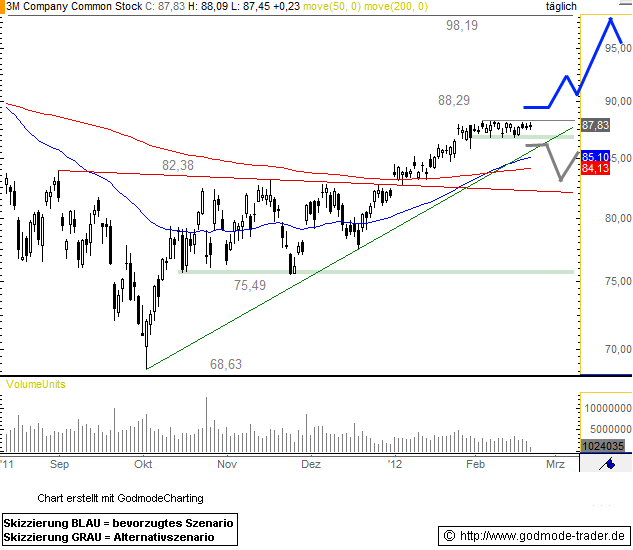 |
S | 87.43 |
02/02/12 | BoGo | |||||
| 02/21/12 | INTC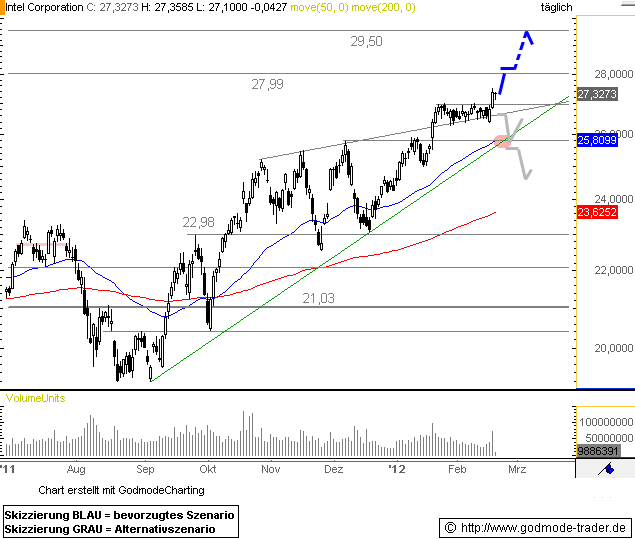 |
S | 26.49 |
02/02/12 | BoGo | |||||
| 02/21/12 | AA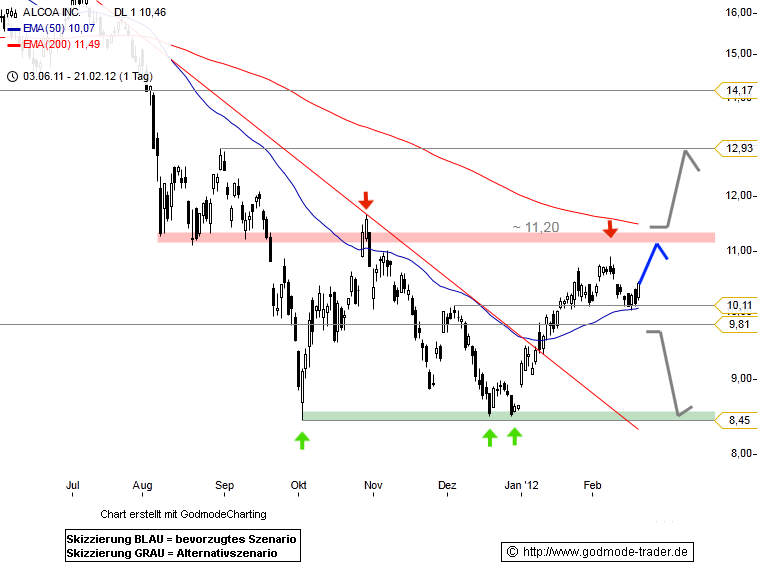 |
S | 10.42 |
02/02/12 | BoGo | |||||
| 02/21/12 | WMT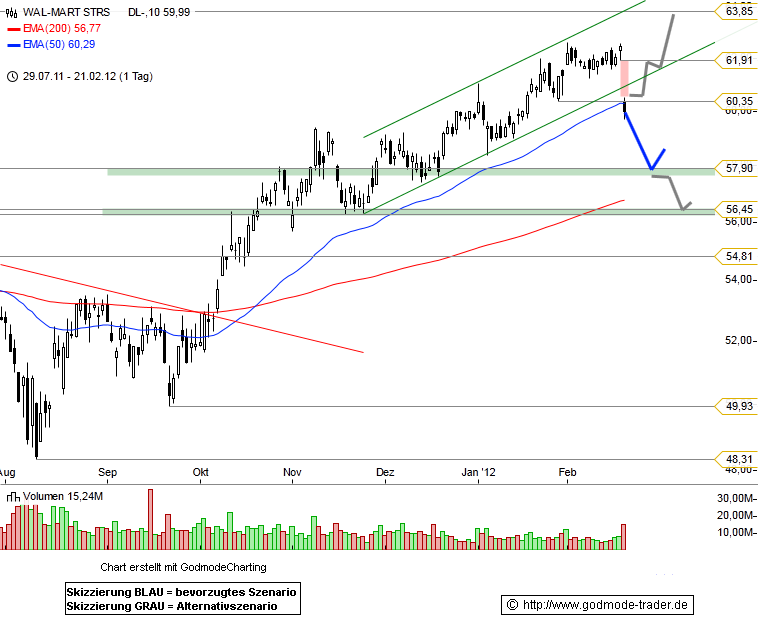 |
S | 61.94 |
02/02/12 | BoGo | |||||
| 02/17/12 | AMGN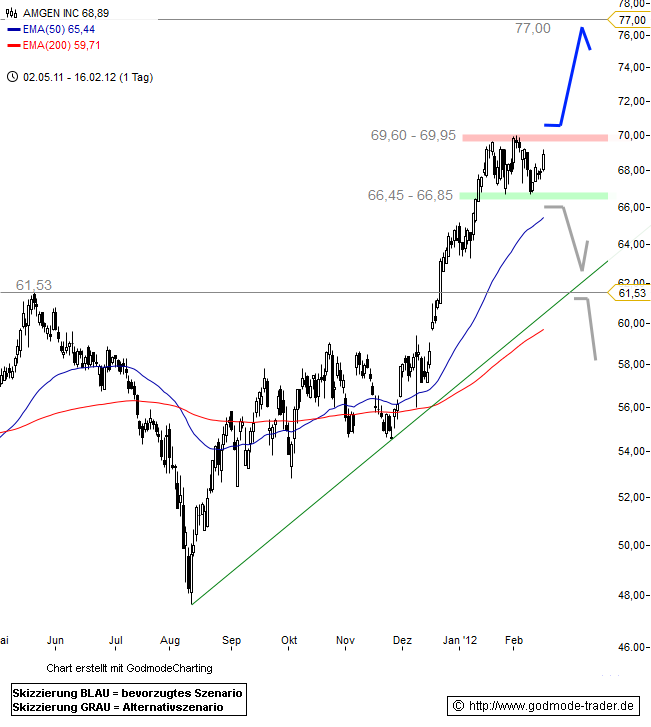 |
S | 69.62 |
02/02/12 | BoGo | |||||
| 02/17/12 | MCD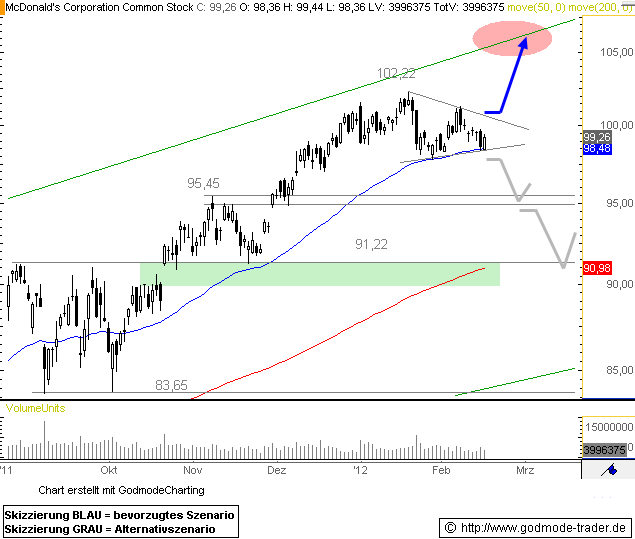 |
S | 98.62 |
02/02/12 | BoGo | |||||
| 02/17/12 | IBM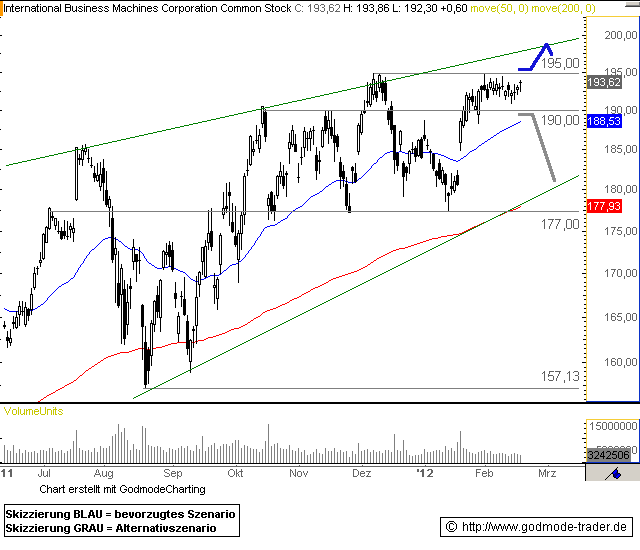 |
S | 191.53 |
02/02/12 | BoGo | |||||
| 02/17/12 | SPLS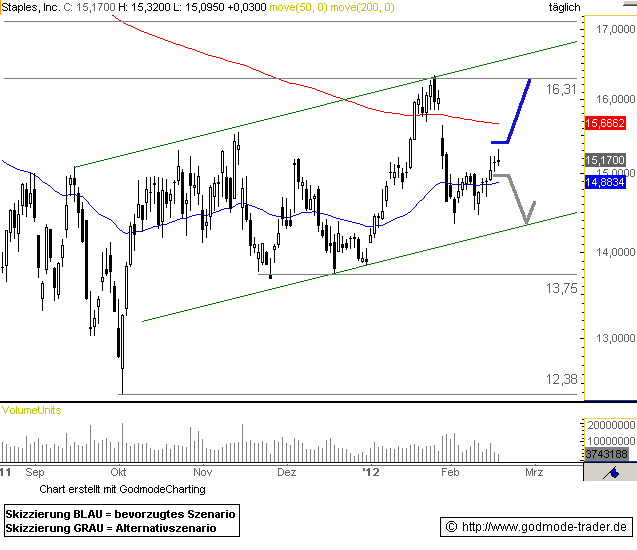 |
S | 14.49 |
02/02/12 | BoGo | |||||
| 02/17/12 | WMT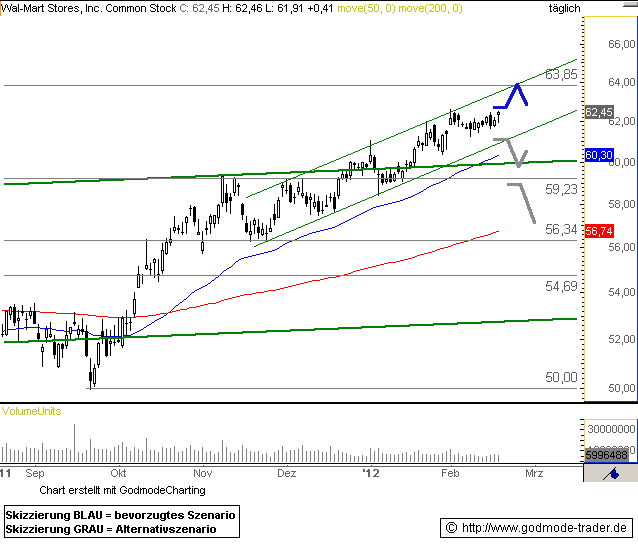 |
S | 61.94 |
02/02/12 | BoGo | |||||
| 02/16/12 | PCLN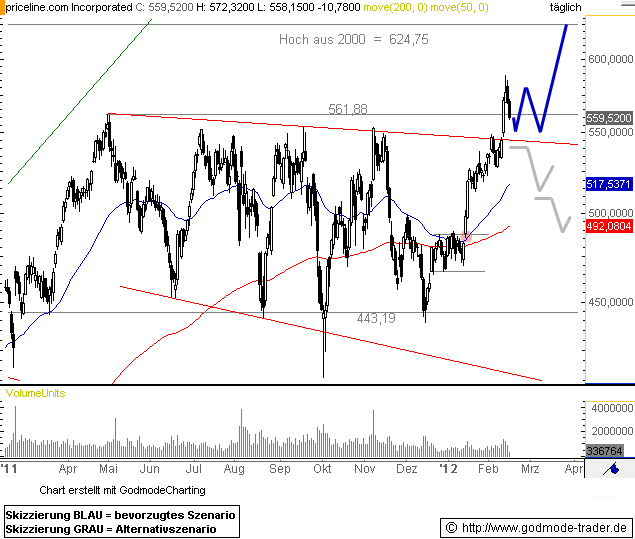 |
S | 533.83 |
02/02/12 | BoGo | |||||
| 02/16/12 | AMZN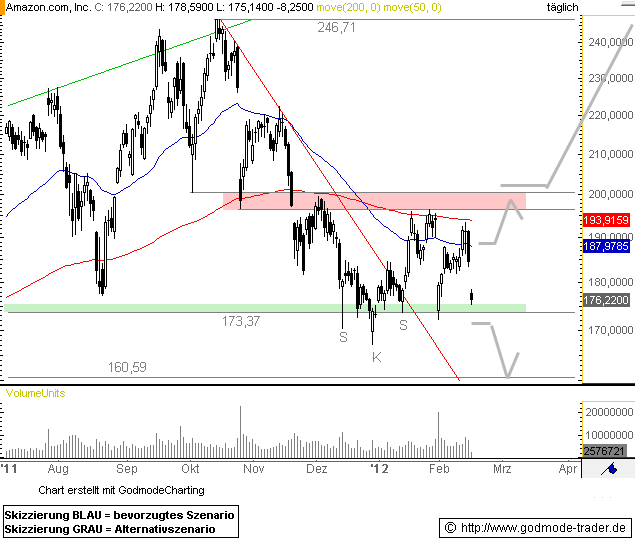 |
S | 181.72 |
02/02/12 | BoGo | |||||
| 02/16/12 | GLD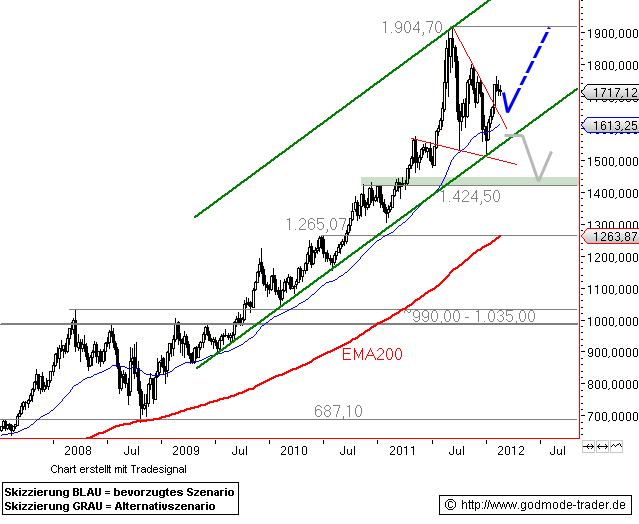 |
S | 171.05 |
02/02/12 | BoGo | |||||
| 02/16/12 | AAPL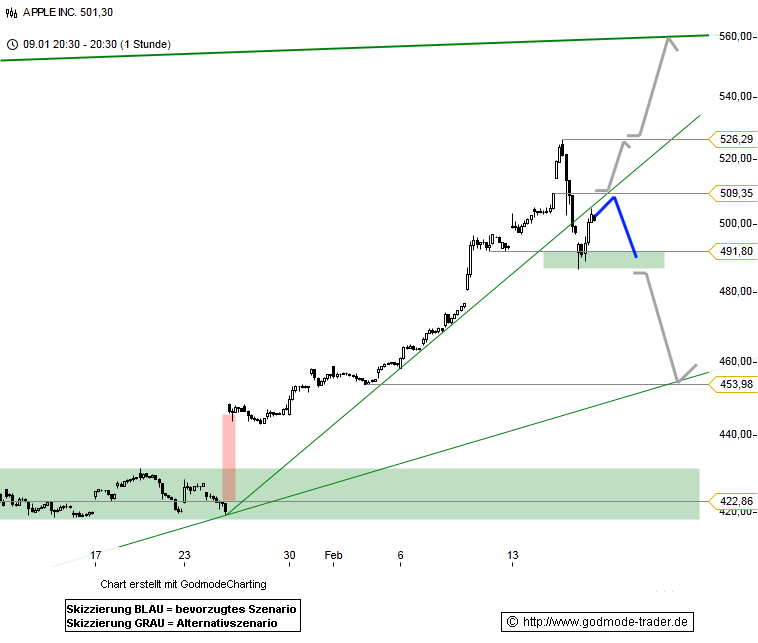 |
S | 455.12 |
02/02/12 | BoGo | |||||
| 02/16/12 | TEVA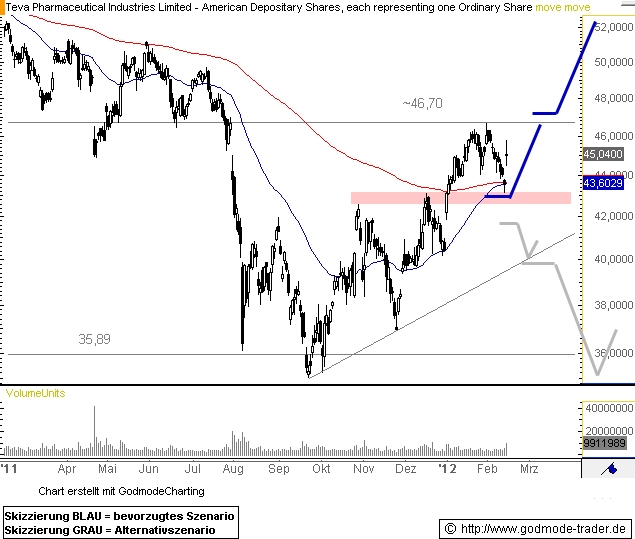 |
S | 45.91 |
02/02/12 | BoGo | |||||
| 02/15/12 | HD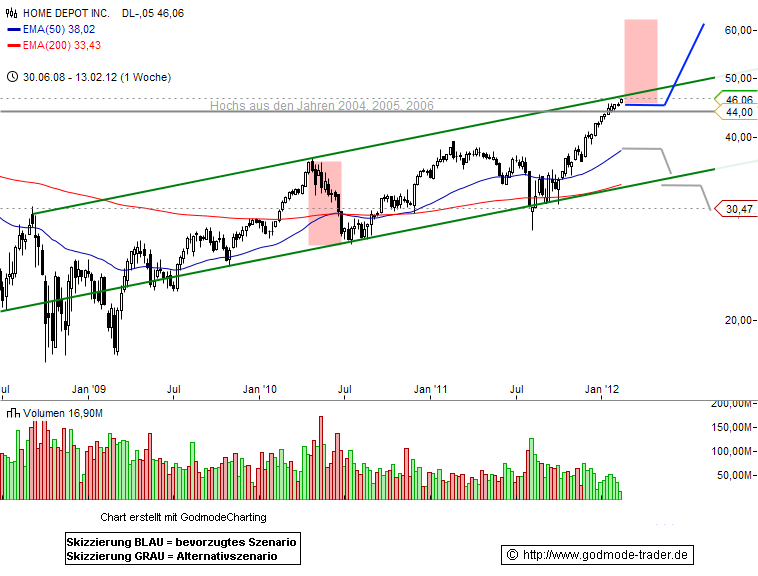 |
S | 44.46 |
02/02/12 | BoGo | |||||
| 02/15/12 | GE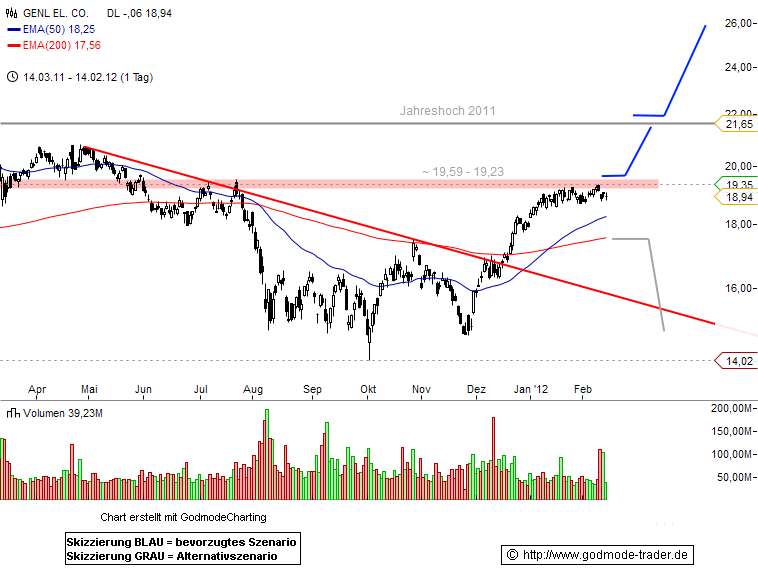 |
S | 18.75 |
02/02/12 | BoGo | |||||
| 02/15/12 | AAPL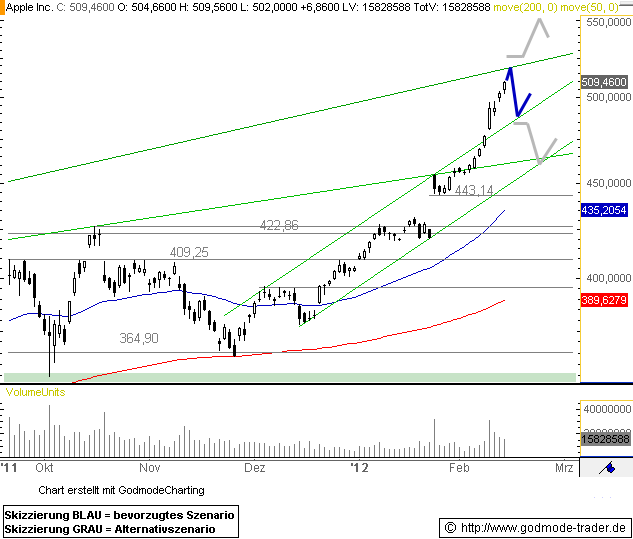 |
S | 455.12 |
02/02/12 | BoGo | |||||
| 02/15/12 | JPM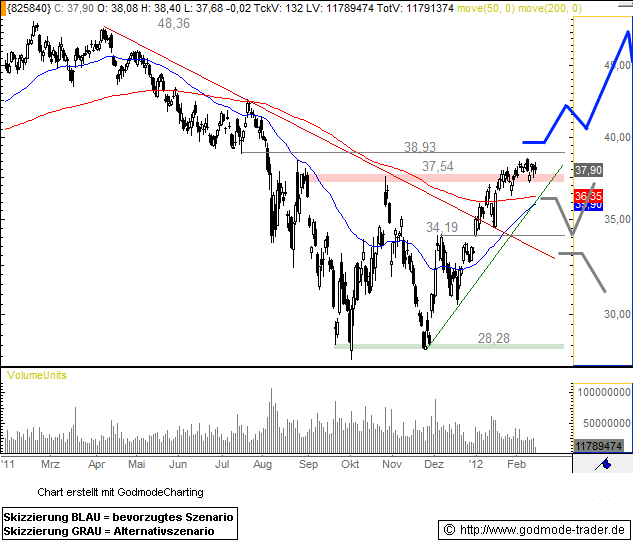 |
S | 37.55 |
02/02/12 | BoGo | |||||
| 02/15/12 | VRSN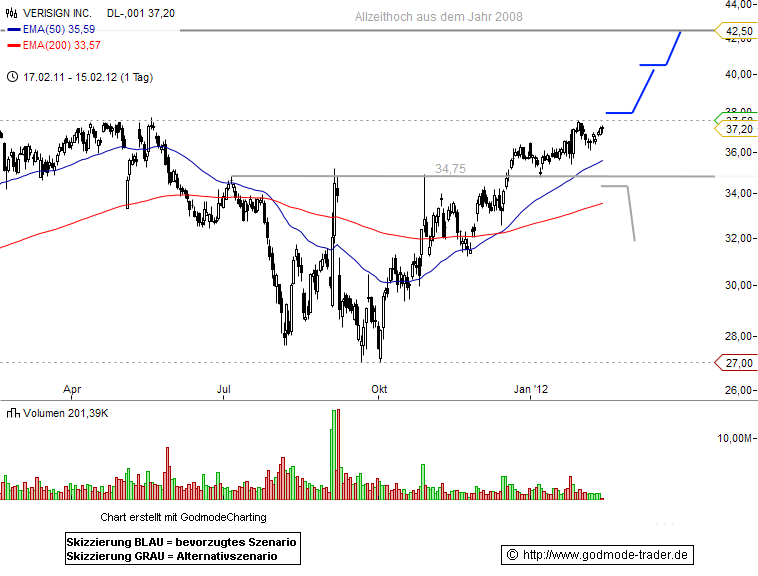 |
S | 36.83 |
02/02/12 | BoGo | |||||
| 02/14/12 | GOOG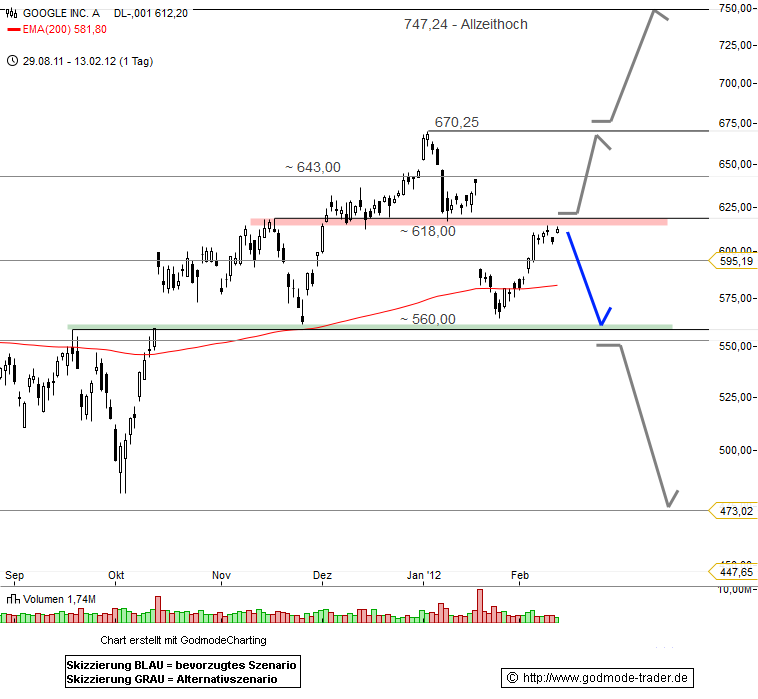 |
S | 585.11 |
02/02/12 | BoGo | |||||
| 02/14/12 | 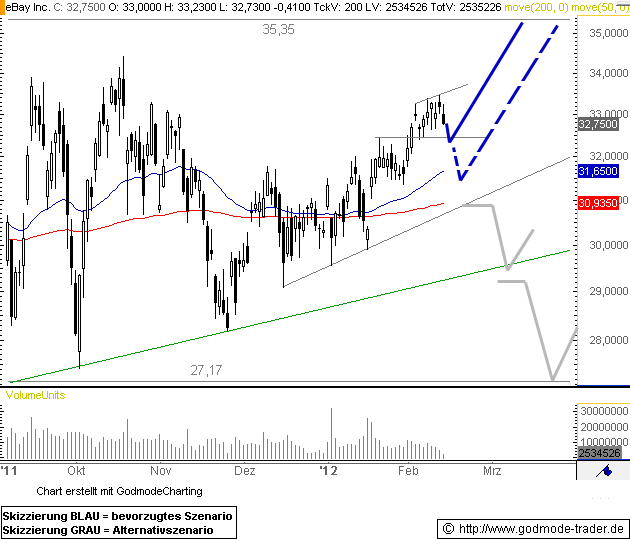 |
S | BoGo | |||||||
| 02/13/12 | EA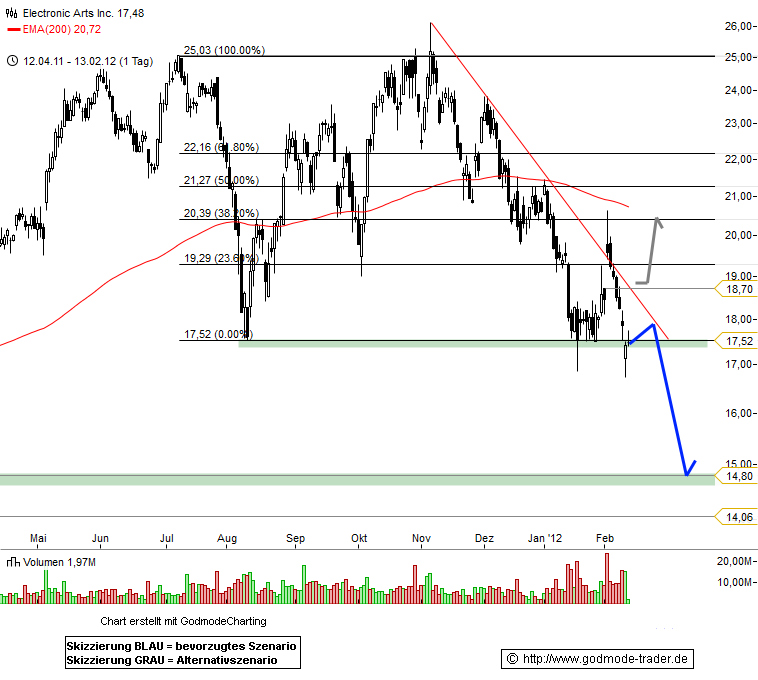 |
S | 19.57 |
02/02/12 | BoGo | |||||
| 02/13/12 | WMT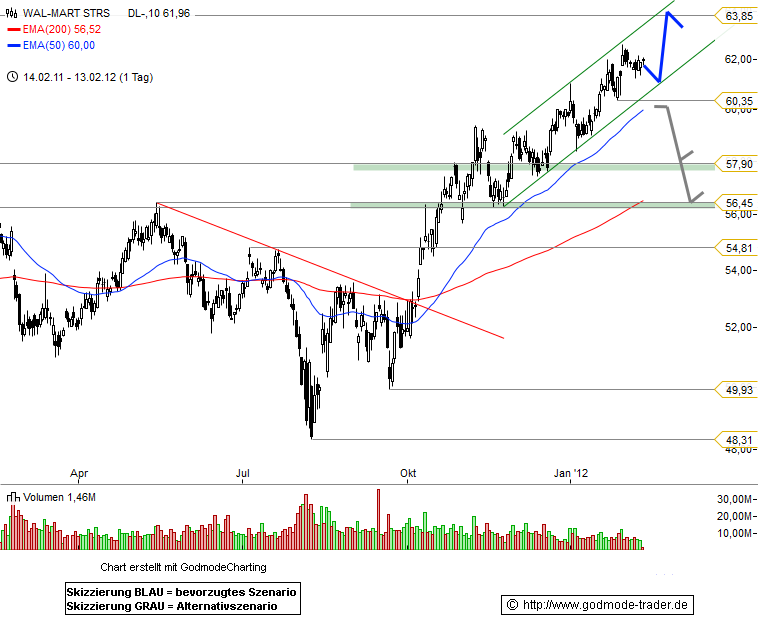 |
S | 61.94 |
02/02/12 | BoGo | |||||
| 02/13/12 | AMZN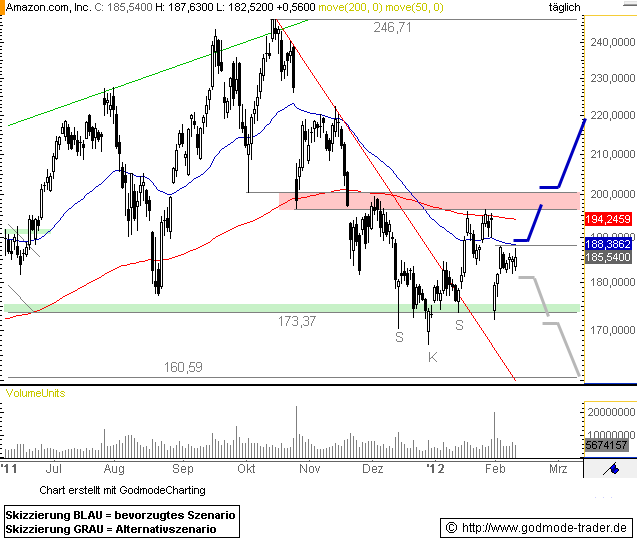 |
S | 181.72 |
02/02/12 | BoGo | |||||
| 02/10/12 | SBUX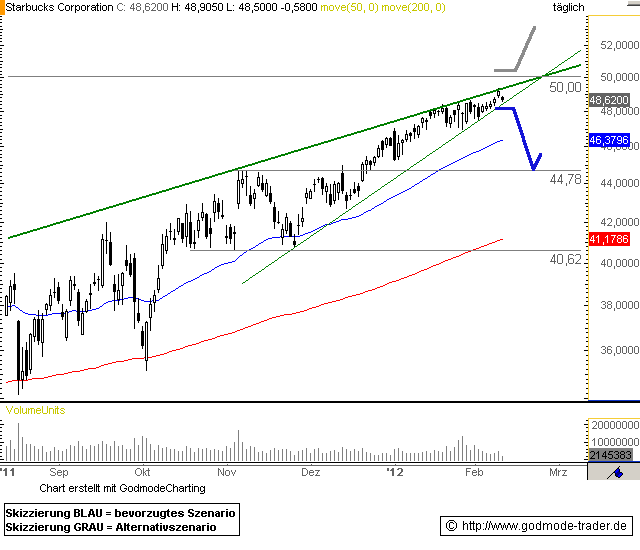 |
S | 47.66 |
02/02/12 | BoGo | |||||
| 02/10/12 | PCLN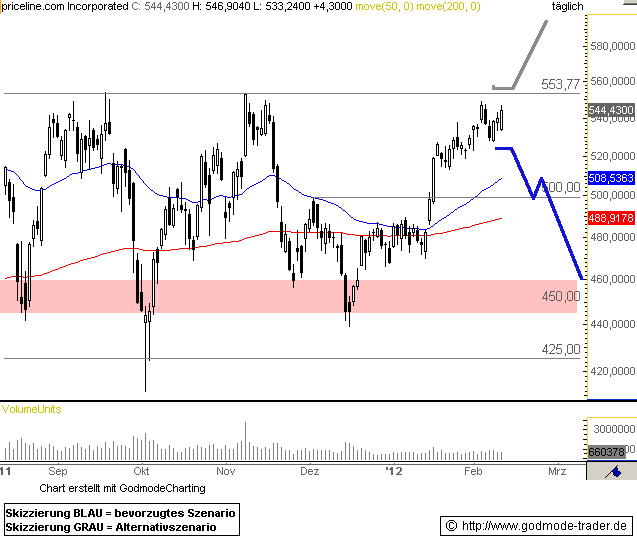 |
S | 533.83 |
02/02/12 | BoGo | |||||
| 02/10/12 | T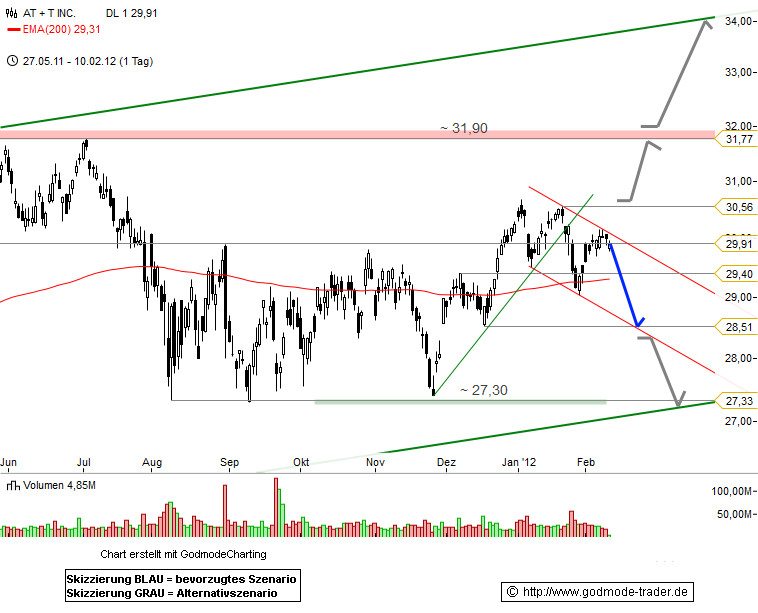 |
S | 29.79 |
02/02/12 | BoGo | |||||
| 02/10/12 | AAPL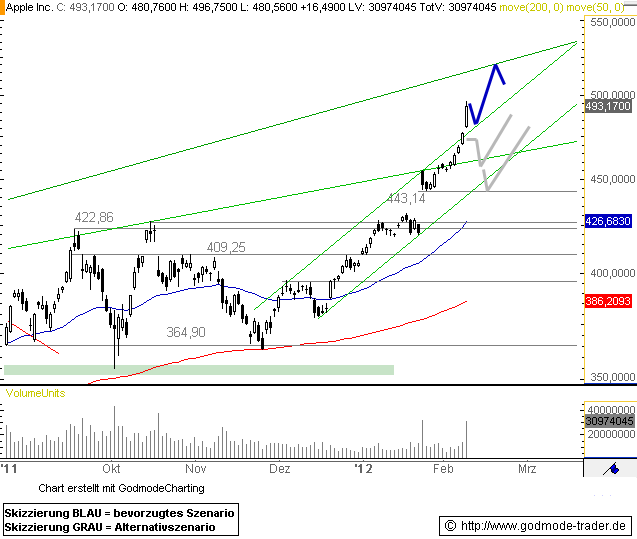 |
S | 455.12 |
02/02/12 | BoGo | |||||
| 02/10/12 | HPQ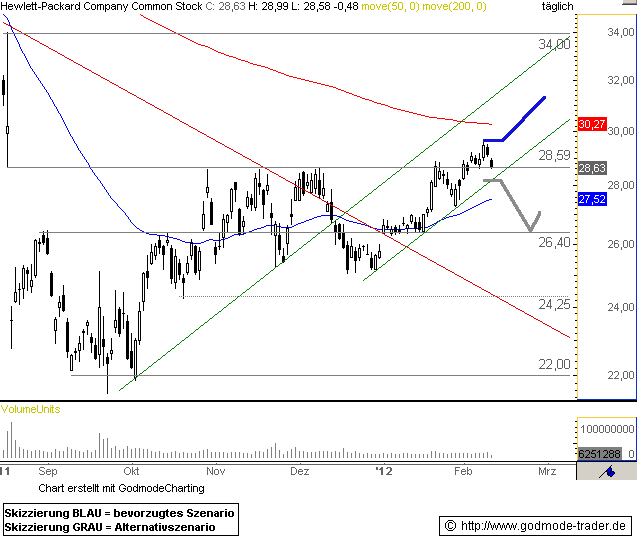 |
S | 28.50 |
02/02/12 | BoGo | |||||
| 02/09/12 | INTC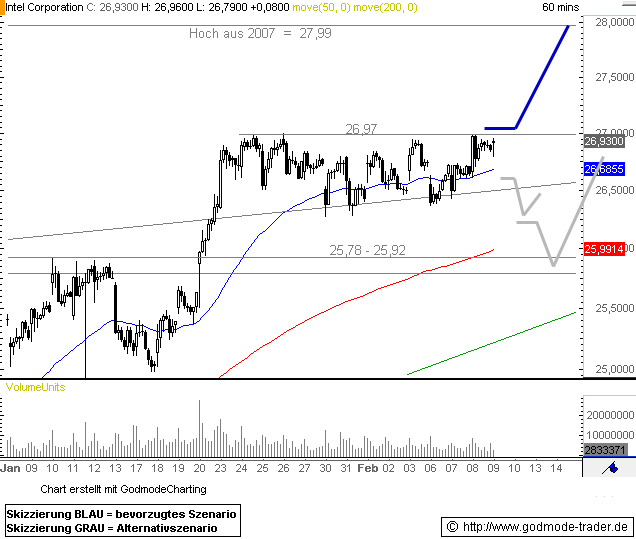 |
S | 26.49 |
02/02/12 | BoGo | |||||
| 02/09/12 | F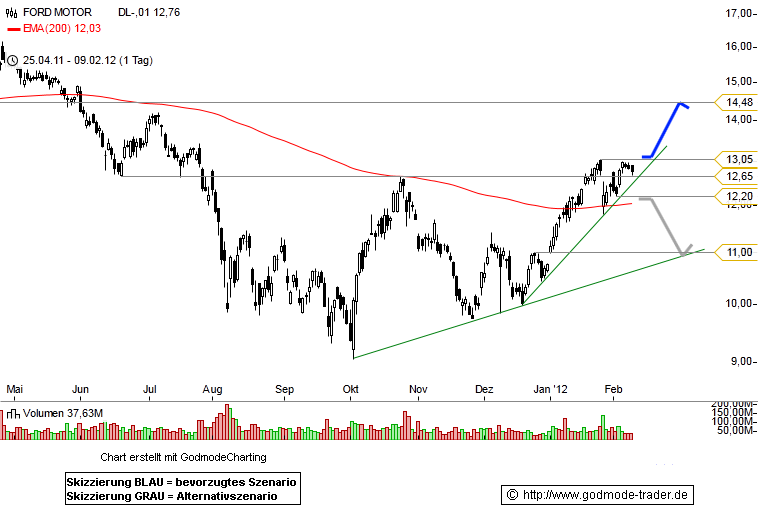 |
S | 12.26 |
02/02/12 | BoGo | |||||
| 02/09/12 | C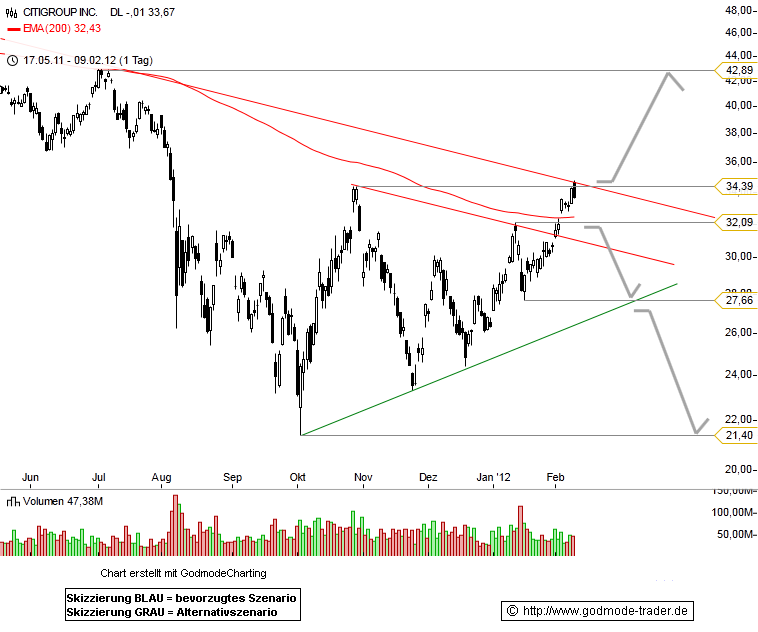 |
S | 31.99 |
02/02/12 | BoGo | |||||
| 02/09/12 | KO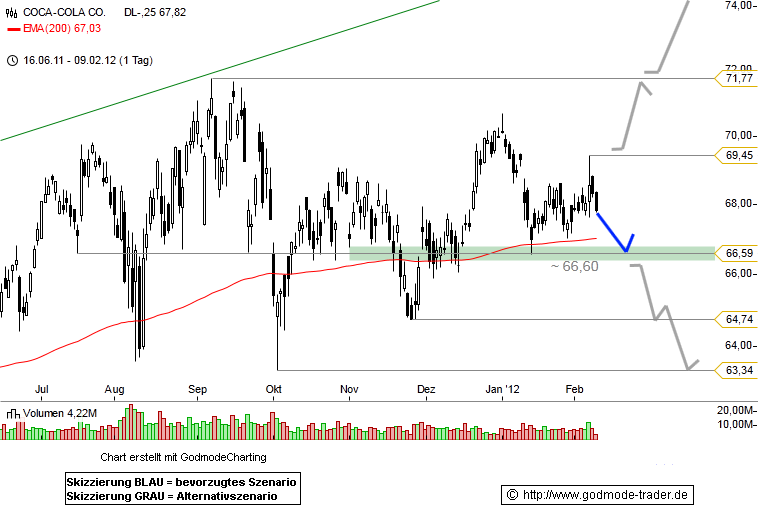 |
S | 67.83 |
02/02/12 | BoGo | |||||
| 02/09/12 | 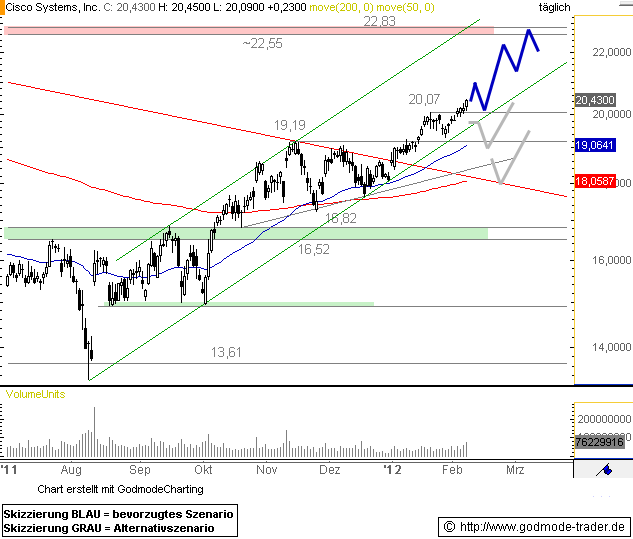 |
S | BoGo | |||||||
| 02/08/12 | NVDA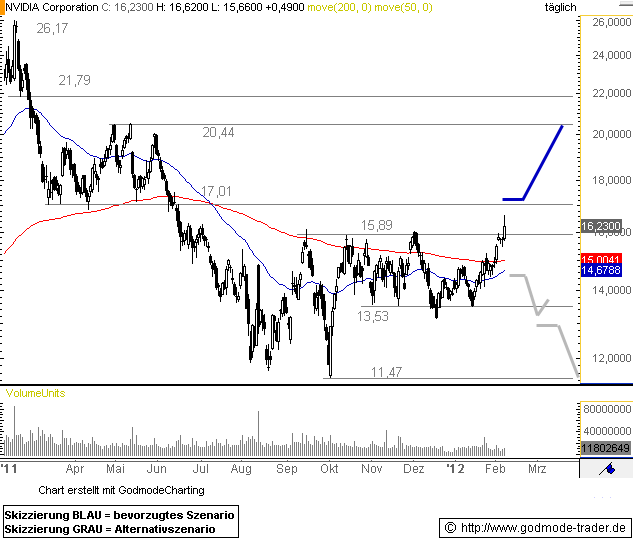 |
S | 15.49 |
02/02/12 | BoGo | |||||
| 02/07/12 | SBUX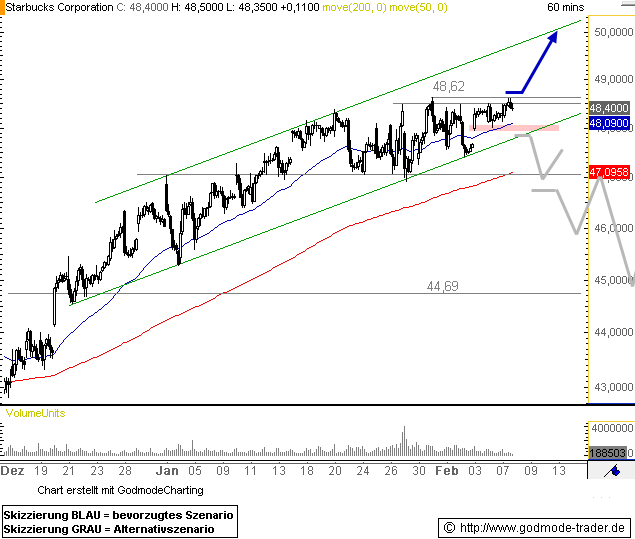 |
S | 47.66 |
02/02/12 | BoGo | |||||
| 02/07/12 | INTC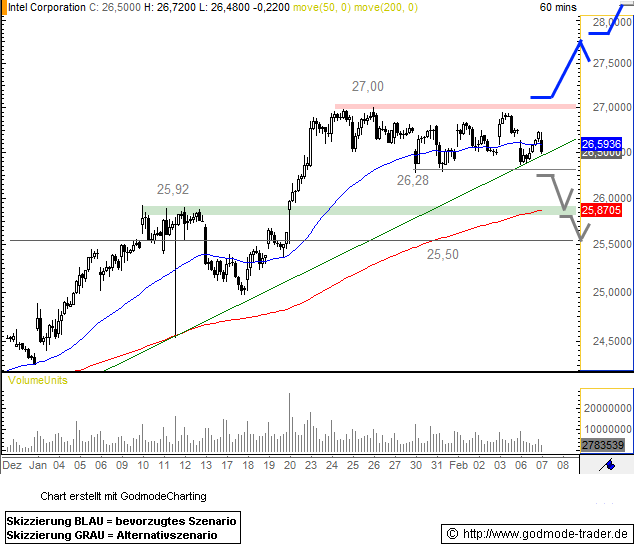 |
S | 26.49 |
02/02/12 | BoGo | |||||
| 02/07/12 | BAC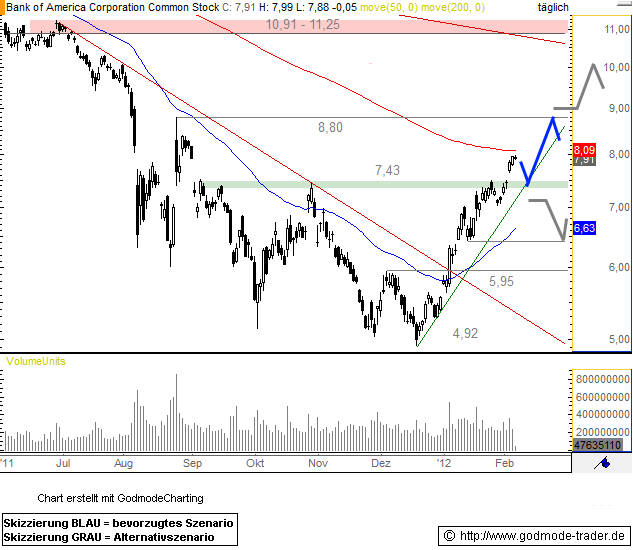 |
S | 7.45 |
02/02/12 | BoGo | |||||
| 02/07/12 | MSFT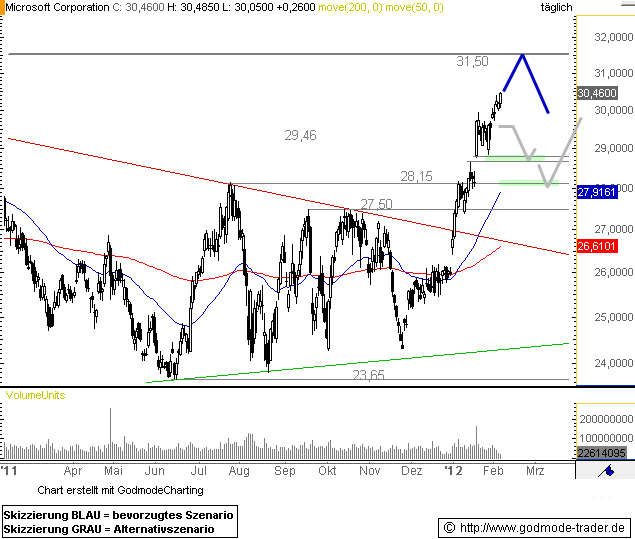 |
S | 29.95 |
02/02/12 | BoGo | |||||
| 02/07/12 | AAPL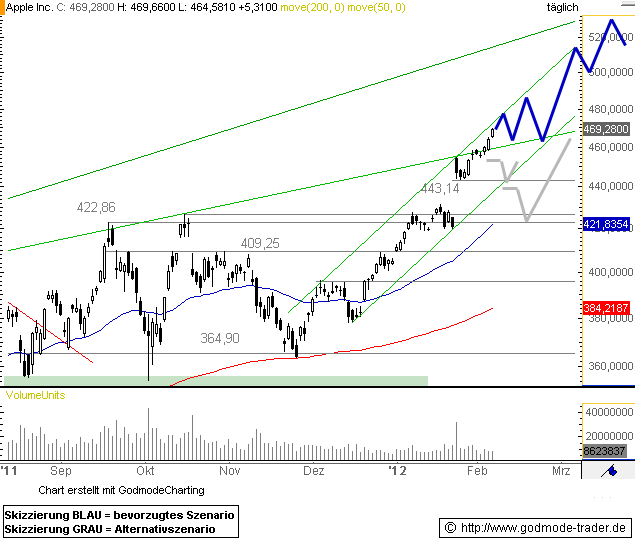 |
S | 455.12 |
02/02/12 | BoGo | |||||
| 02/06/12 | FSLR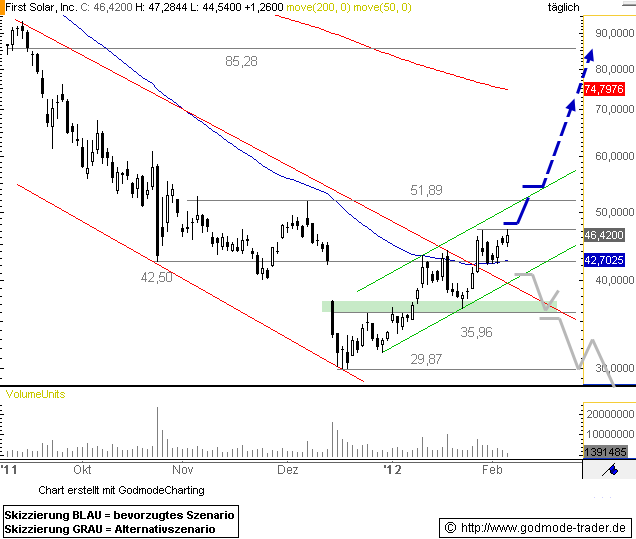 |
S | 44.74 |
02/02/12 | BoGo | |||||
| 02/06/12 | EBAY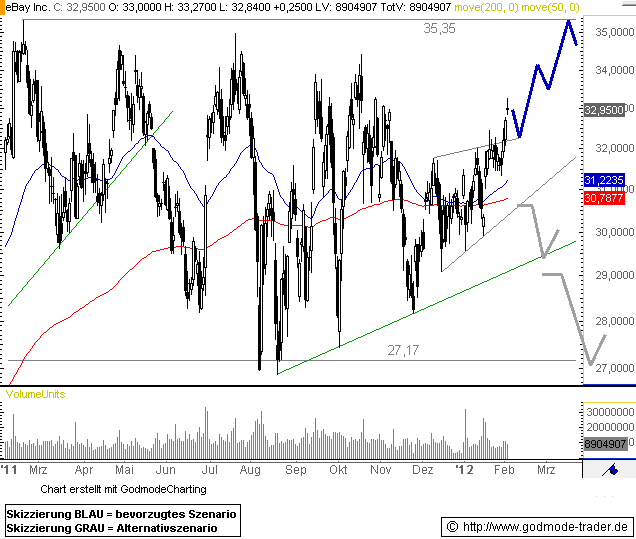 |
S | 32.70 |
02/02/12 | BoGo | |||||
| 02/06/12 | BA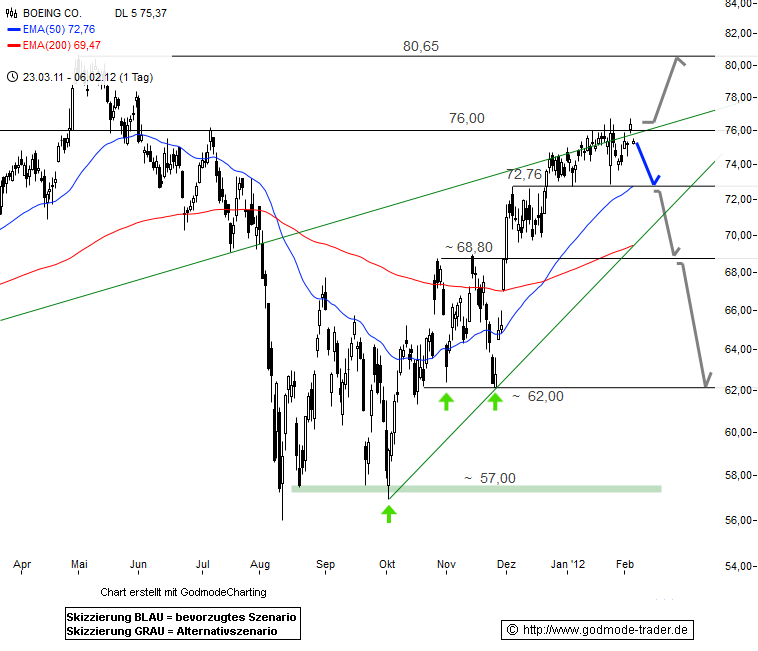 |
S | 75.22 |
02/02/12 | BoGo | |||||
| 02/03/12 | CAT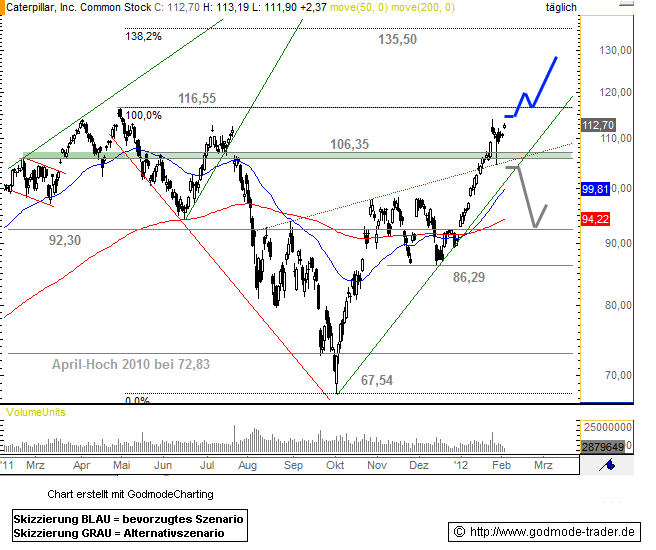 |
S | 110.33 |
02/02/12 | BoGo | |||||
| 02/03/12 | BIDU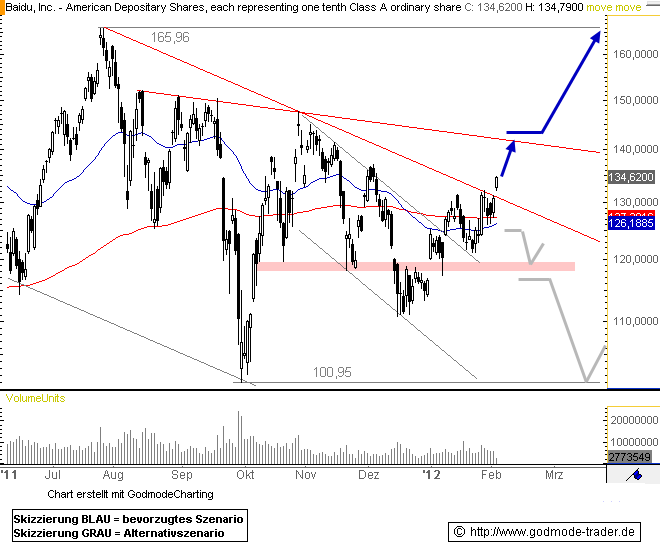 |
S | 130.79 |
02/02/12 | BoGo | |||||
| 02/03/12 | MCD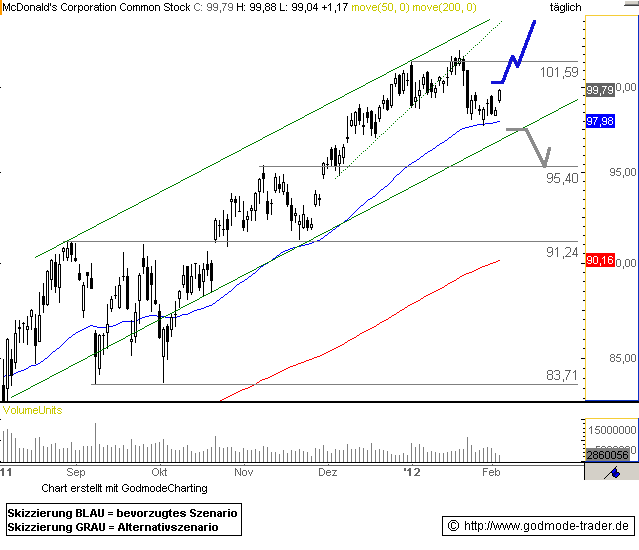 |
S | 98.62 |
02/02/12 | BoGo | |||||
| 02/03/12 | AMZN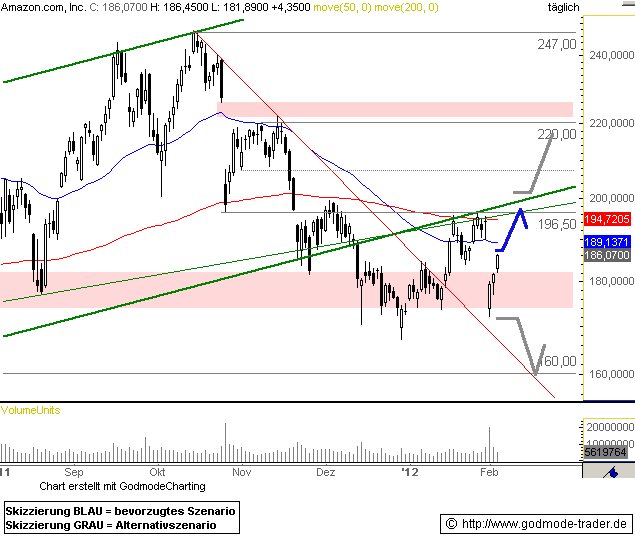 |
S | 181.72 |
02/02/12 | BoGo | |||||
| 02/03/12 | KO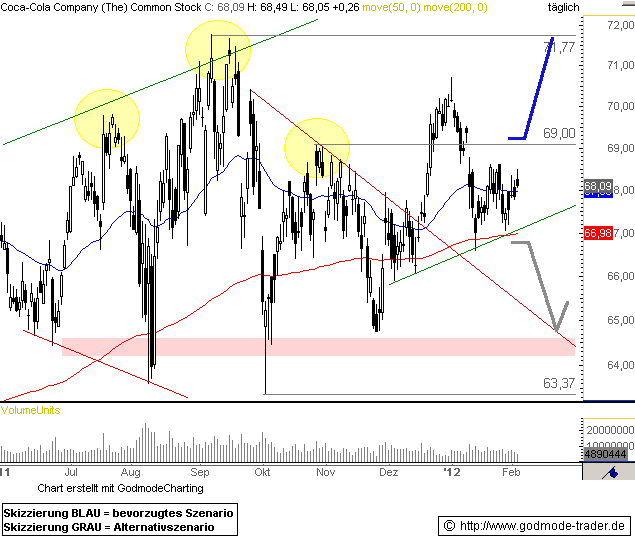 |
S | 67.83 |
02/02/12 | BoGo | |||||
| 02/02/12 | QCOM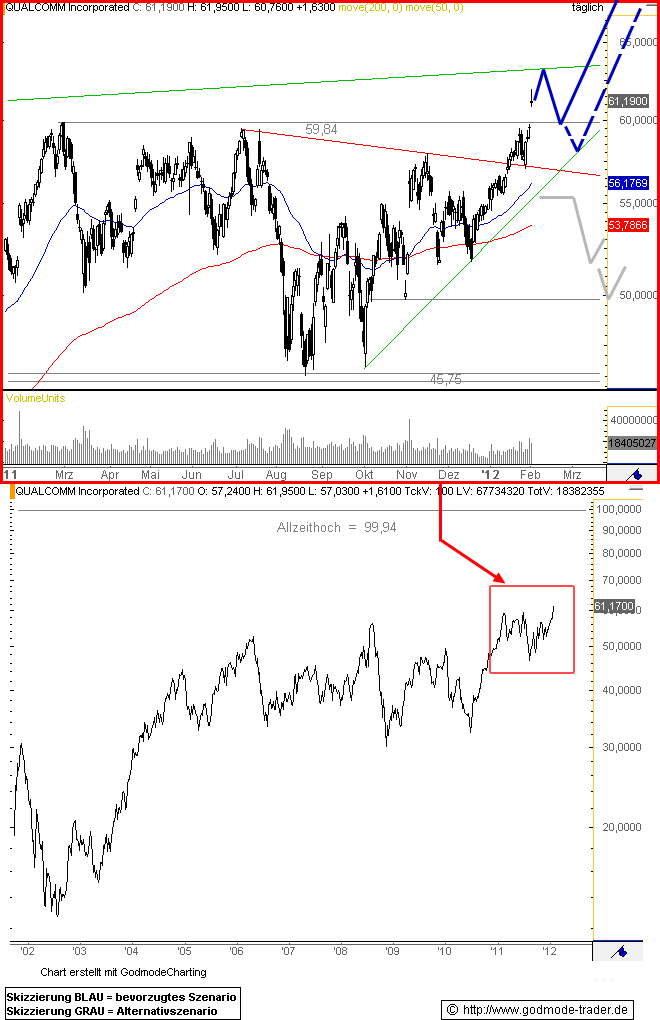 |
S | 60.73 |
02/02/12 | BoGo | |||||
| 02/02/12 | NVDA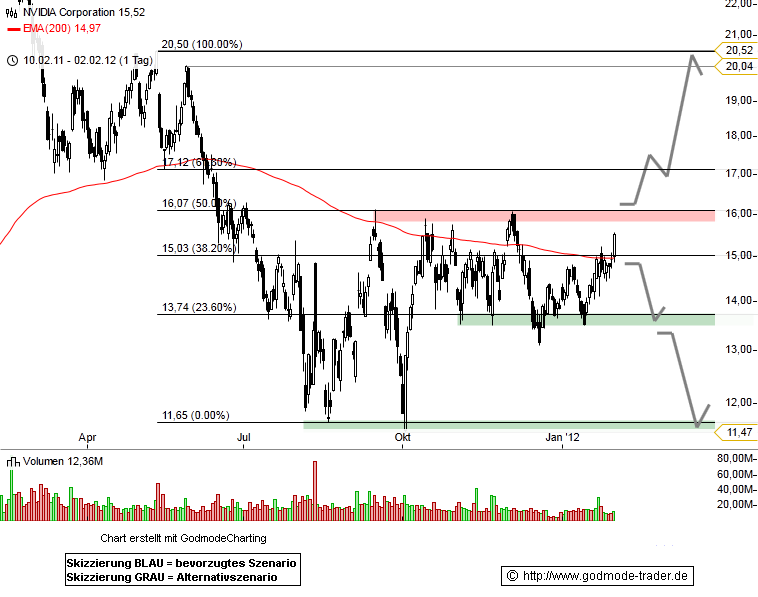 |
S | 15.49 |
02/02/12 | BoGo | |||||
| 02/02/12 | EA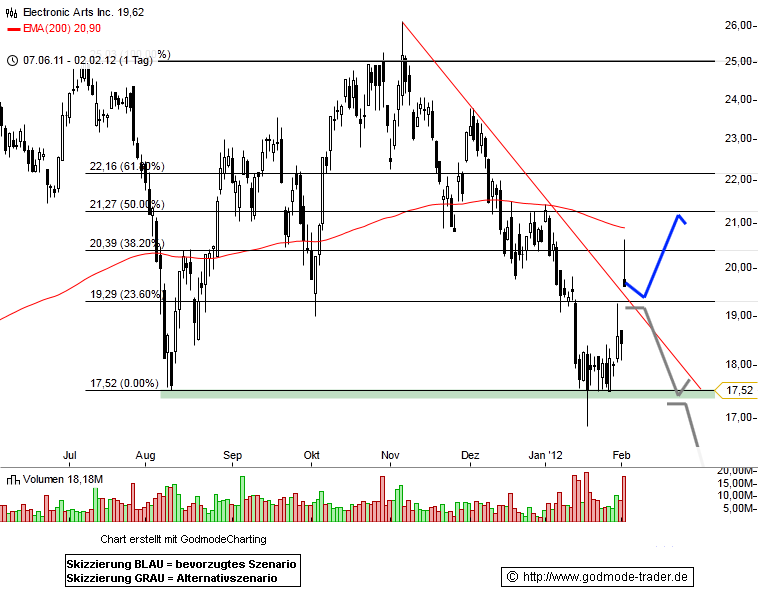 |
S | 19.57 |
02/02/12 | BoGo | |||||
| 02/02/12 | AXP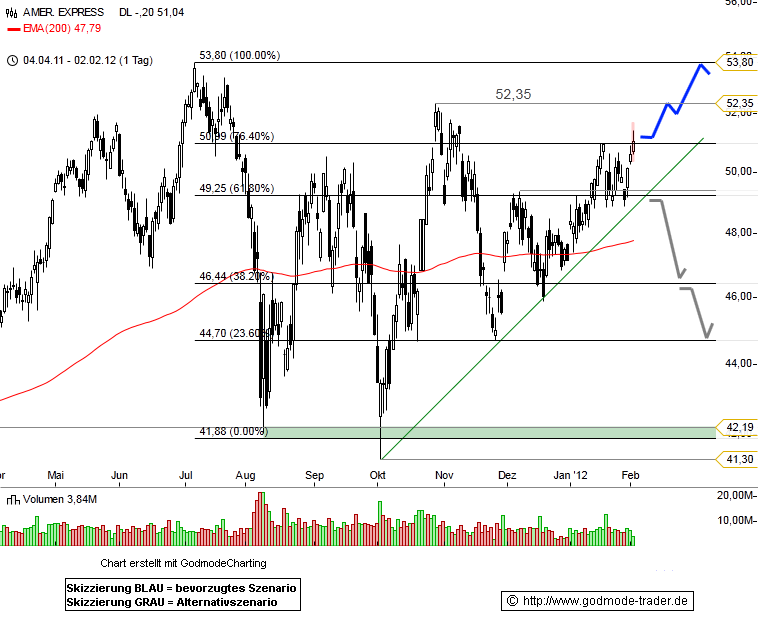 |
S | 51.16 |
02/02/12 | BoGo | |||||
| 02/02/12 | MA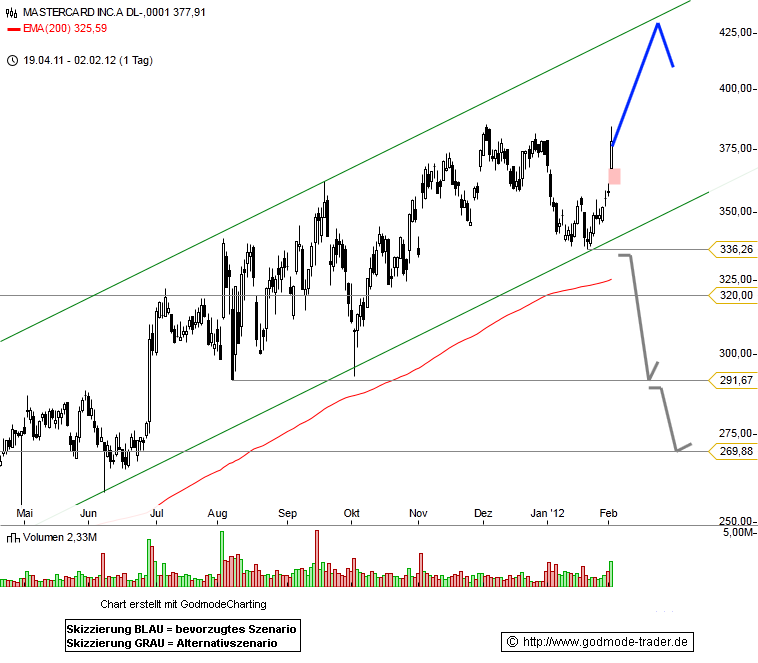 |
S | 381.57 |
02/02/12 | BoGo | |||||
| 02/01/12 | GOOG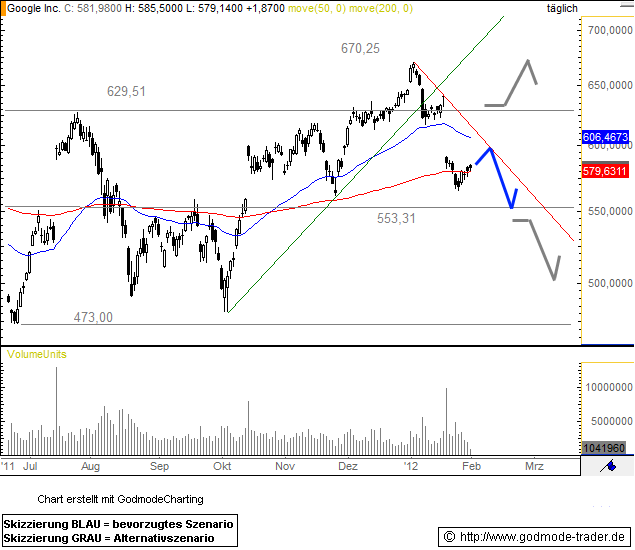 |
S | 585.11 |
02/02/12 | BoGo | |||||
| 02/01/12 | DELL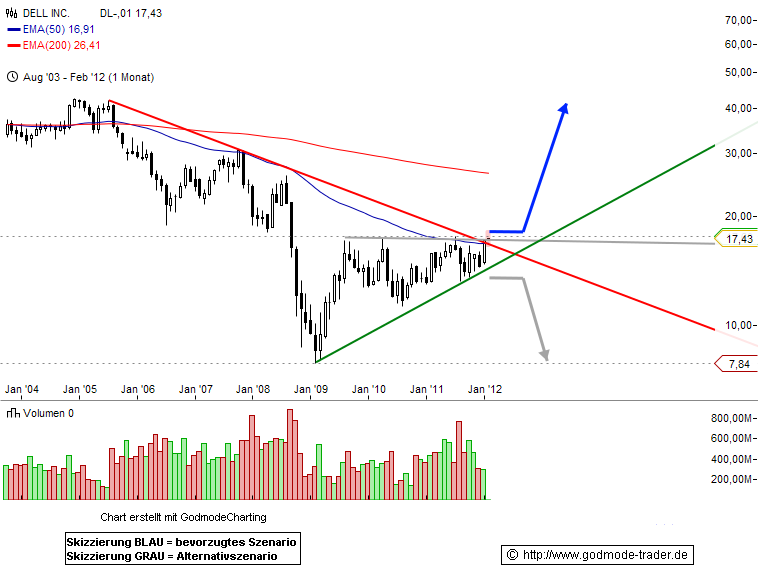 |
S | 17.60 |
02/02/12 | BoGo | |||||
| 02/01/12 | AMZN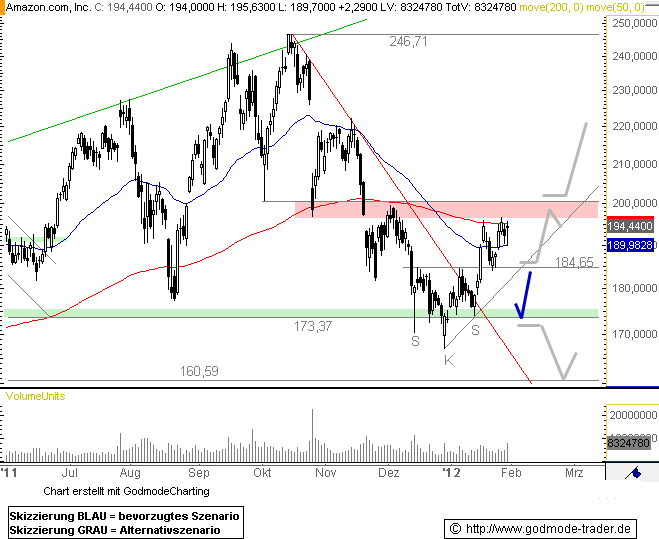 |
S | 181.72 |
02/02/12 | BoGo | |||||
| 02/01/12 | AA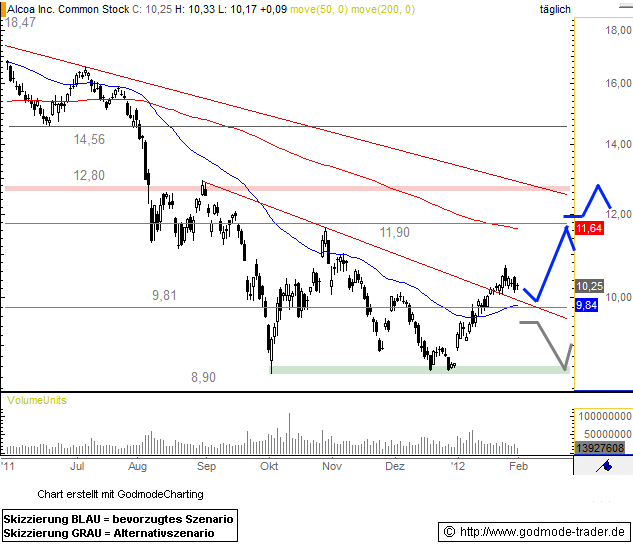 |
S | 10.42 |
02/02/12 | BoGo | |||||
| 01/31/12 | DD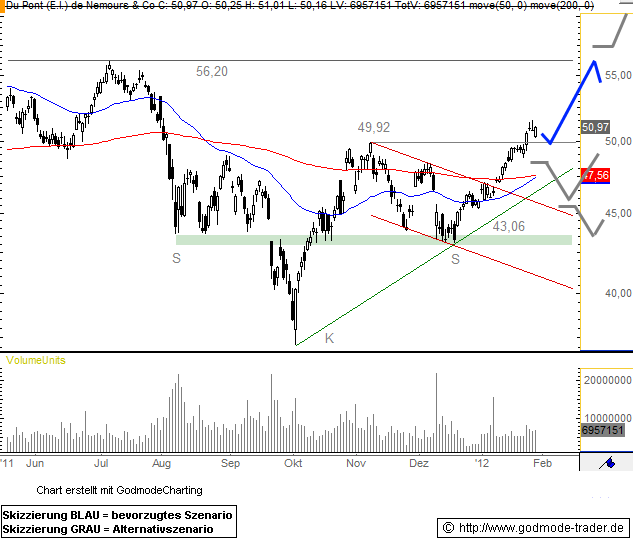 |
S | 51.40 |
02/02/12 | BoGo | |||||
| 01/31/12 | CSCO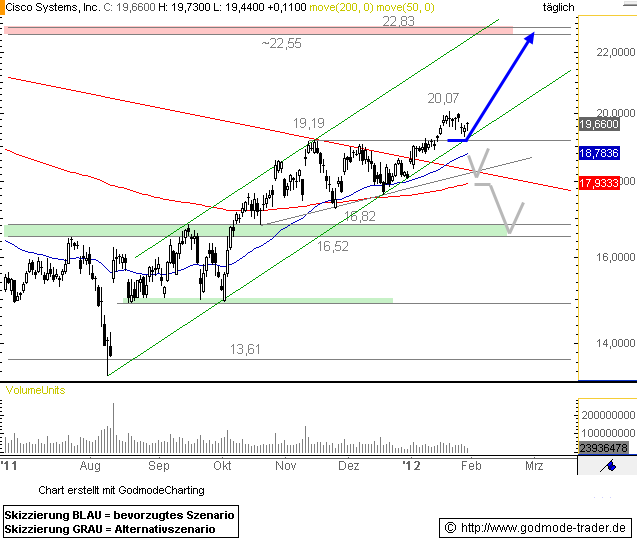 |
S | 19.80 |
02/02/12 | BoGo | |||||
| 01/31/12 | ORCL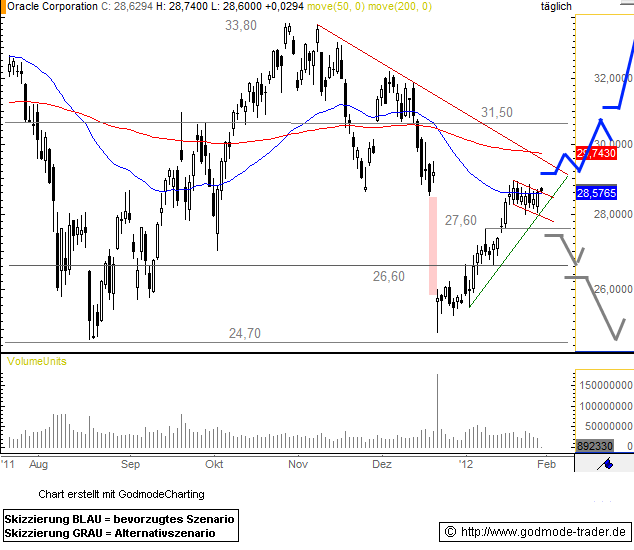 |
S | 28.81 |
02/02/12 | BoGo | |||||
| 01/31/12 | AMZN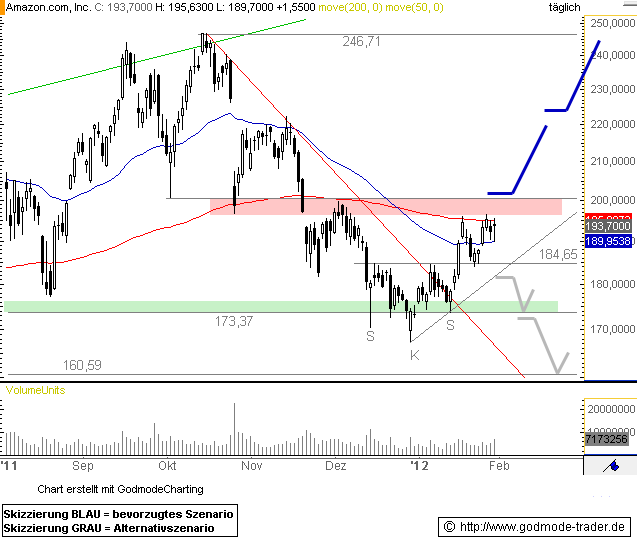 |
S | 181.72 |
02/02/12 | BoGo | |||||
| 01/31/12 | IBM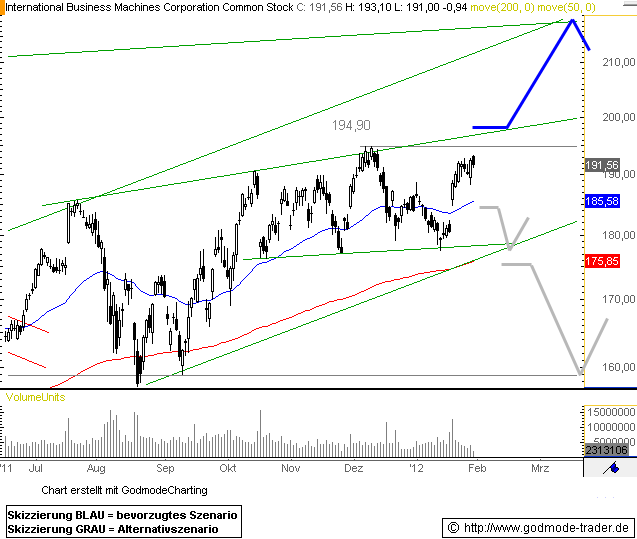 |
S | 191.53 |
02/02/12 | BoGo | |||||
| 01/30/12 | MMM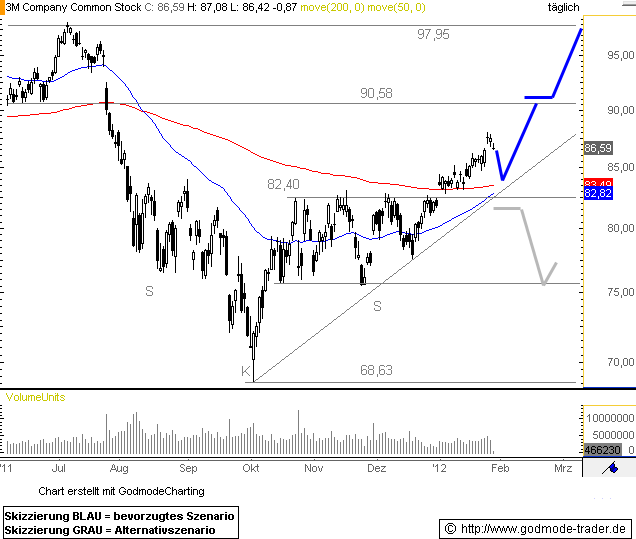 |
S | 87.43 |
02/02/12 | BoGo | |||||
| 01/30/12 | GM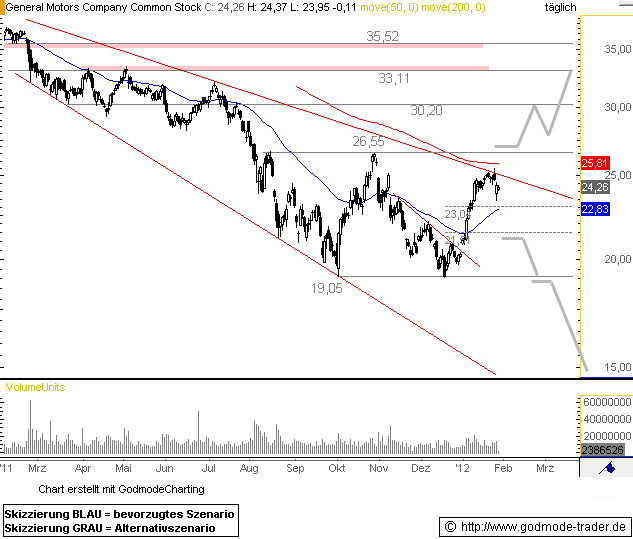 |
S | 24.31 |
02/02/12 | BoGo | |||||
| 01/30/12 | YHOO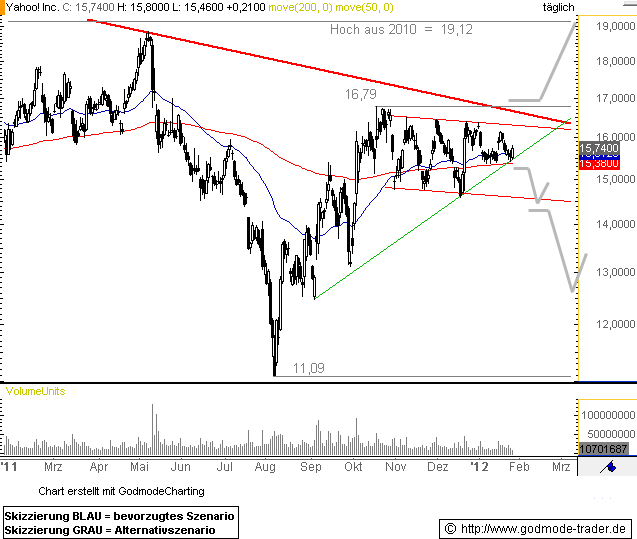 |
S | 15.72 |
02/02/12 | BoGo | |||||
| 01/30/12 | SPLS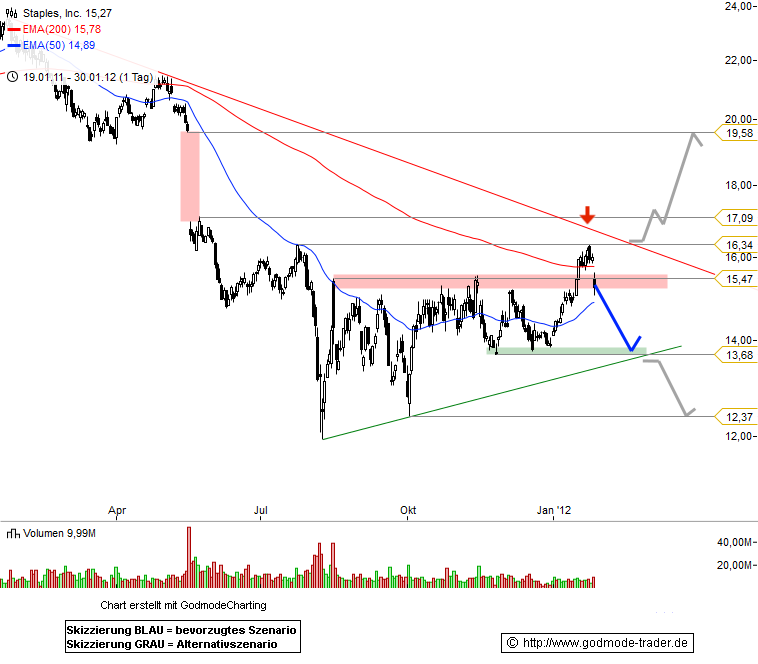 |
S | 14.49 |
02/02/12 | BoGo | |||||
| 01/30/12 | XOM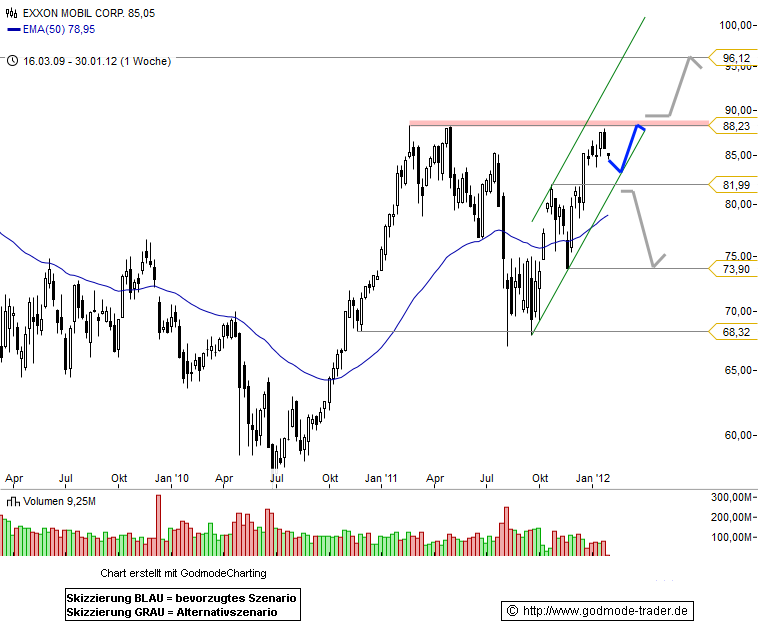 |
S | 83.53 |
02/02/12 | BoGo | |||||
| 01/27/12 | VZ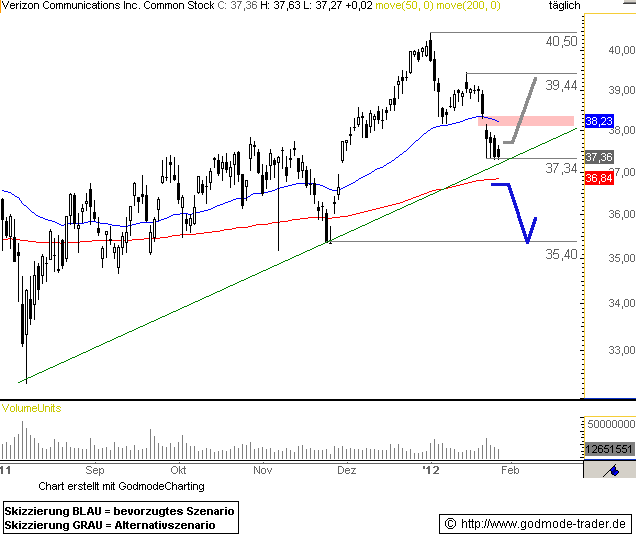 |
S | 37.56 |
02/02/12 | BoGo | |||||
| 01/27/12 | COST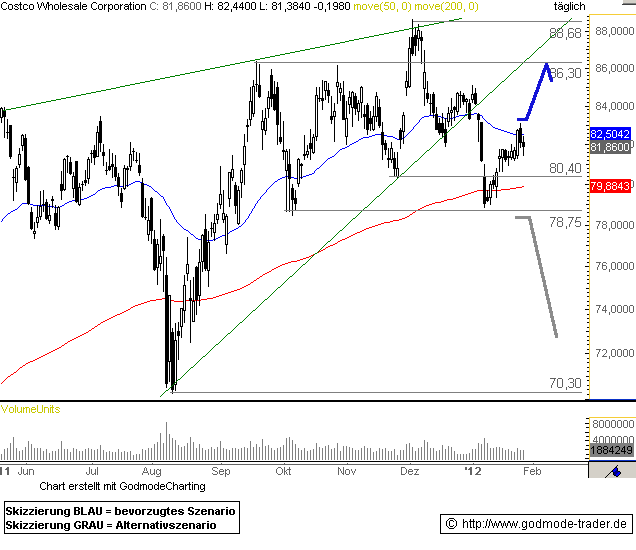 |
S | 85.51 |
02/02/12 | BoGo | |||||
| 01/27/12 | DLTR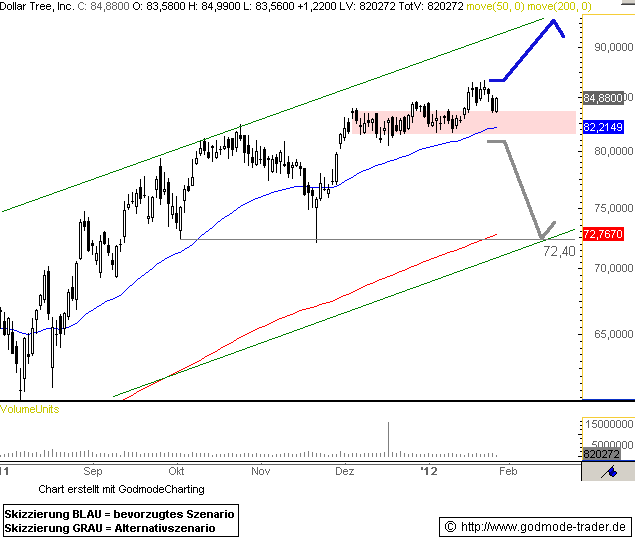 |
S | 86.03 |
02/02/12 | BoGo | |||||
| 01/26/12 | MCD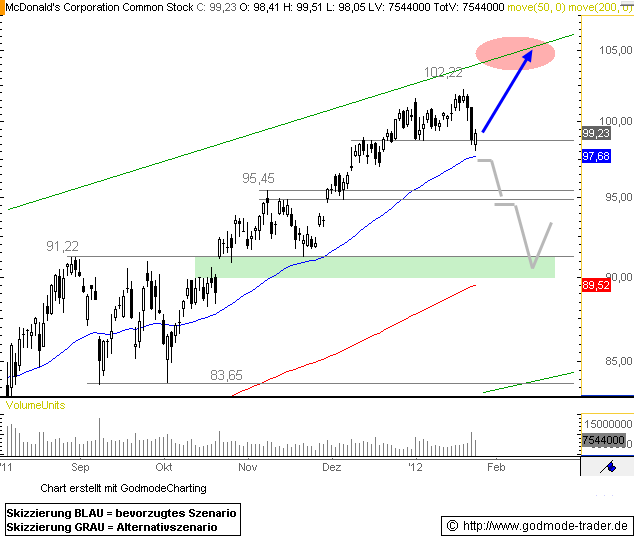 |
S | 98.62 |
02/02/12 | BoGo | |||||
| 01/26/12 | USO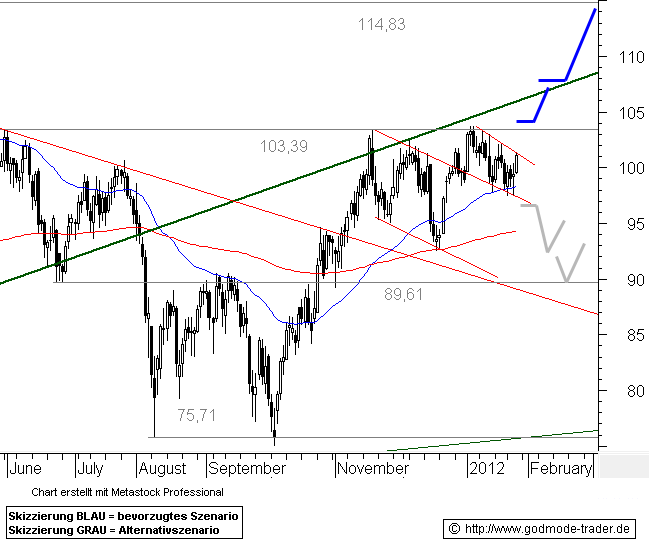 |
S | 37.13 |
02/02/12 | BoGo | |||||
| 01/26/12 | FSLR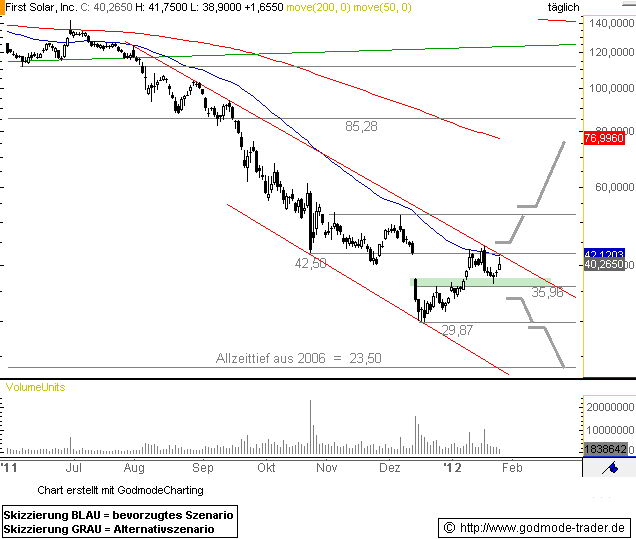 |
S | 44.74 |
02/02/12 | BoGo | |||||
| 01/26/12 | CAT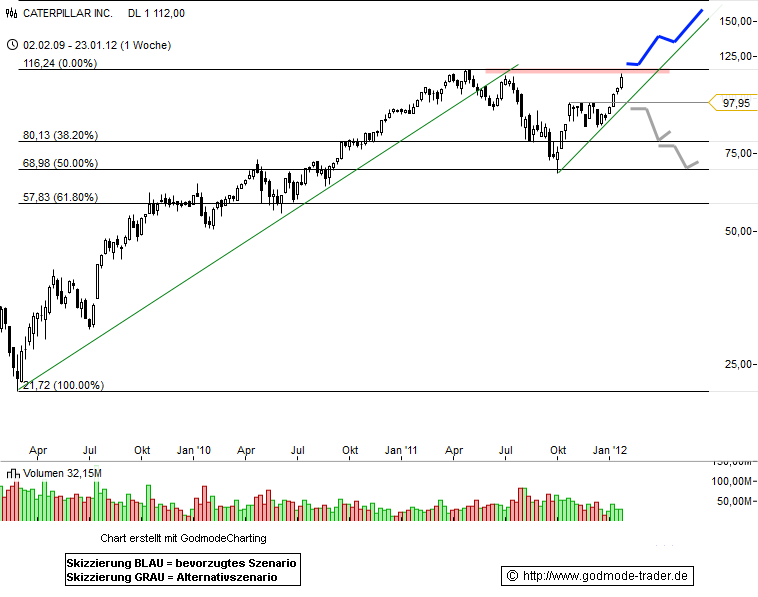 |
S | 110.33 |
02/02/12 | BoGo | |||||
| 01/25/12 | PFE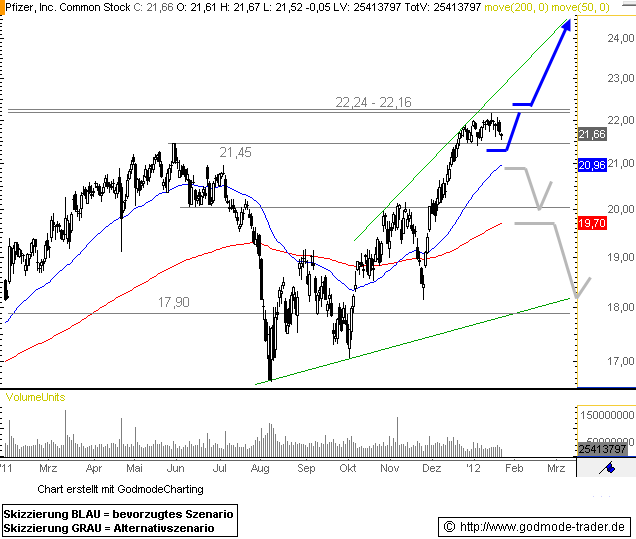 |
S | 21.11 |
02/02/12 | BoGo | |||||
| 01/25/12 | AAPL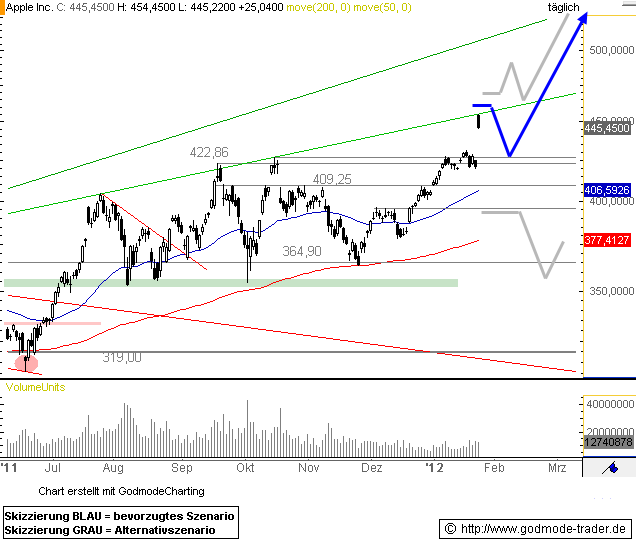 |
S | 455.12 |
02/02/12 | BoGo | |||||
| 01/25/12 | DELL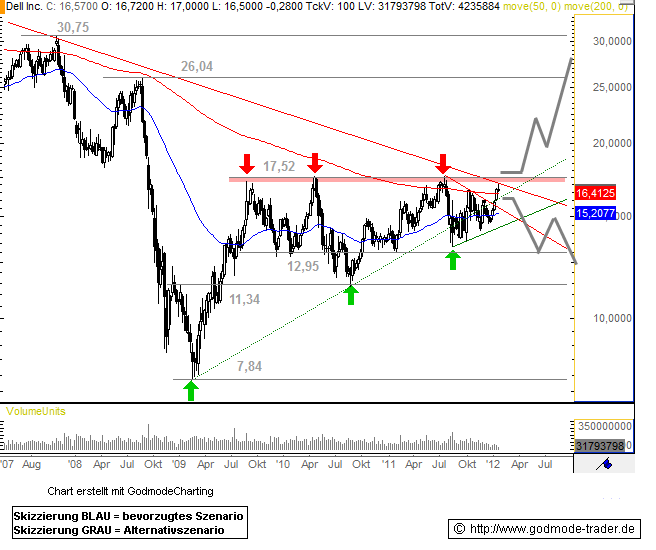 |
S | 17.60 |
02/02/12 | BoGo | |||||
| 01/25/12 | BIDU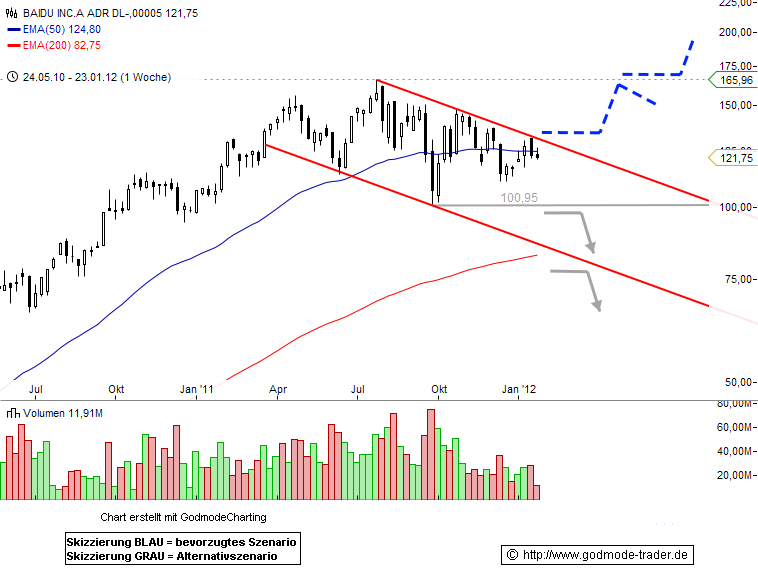 |
S | 130.79 |
02/02/12 | BoGo | |||||
| 01/24/12 | SBUX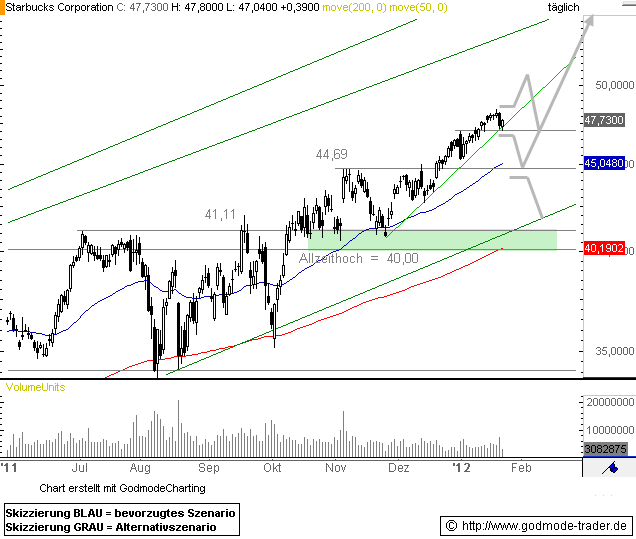 |
S | 47.66 |
02/02/12 | BoGo | |||||
| 01/24/12 | BAC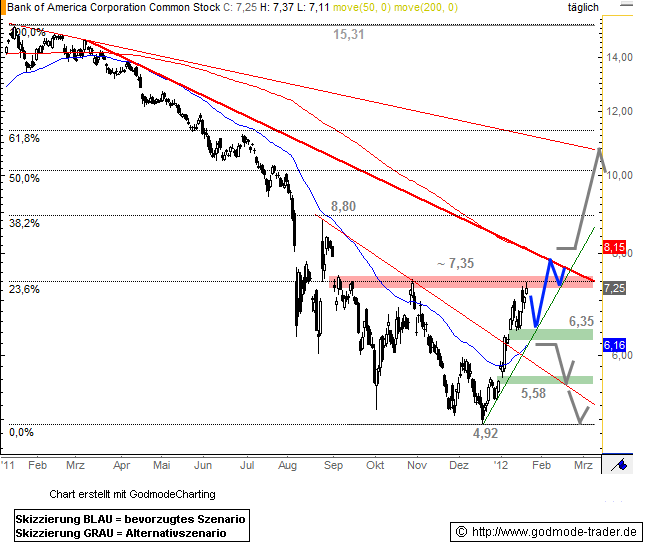 |
S | 7.45 |
02/02/12 | BoGo | |||||
| 01/24/12 | GLD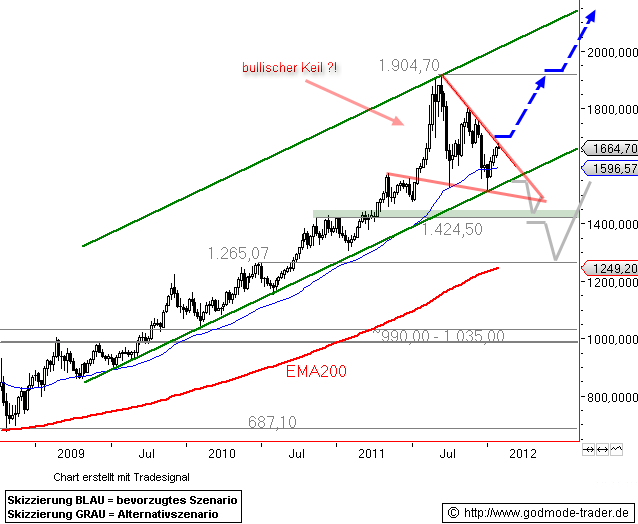 |
S | 171.05 |
02/02/12 | BoGo | |||||
| 01/23/12 | EBAY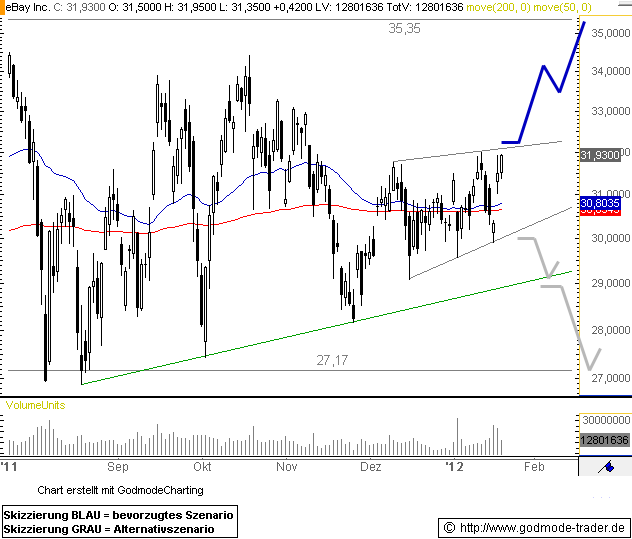 |
S | 32.70 |
02/02/12 | BoGo | |||||
| 01/23/12 | SHLD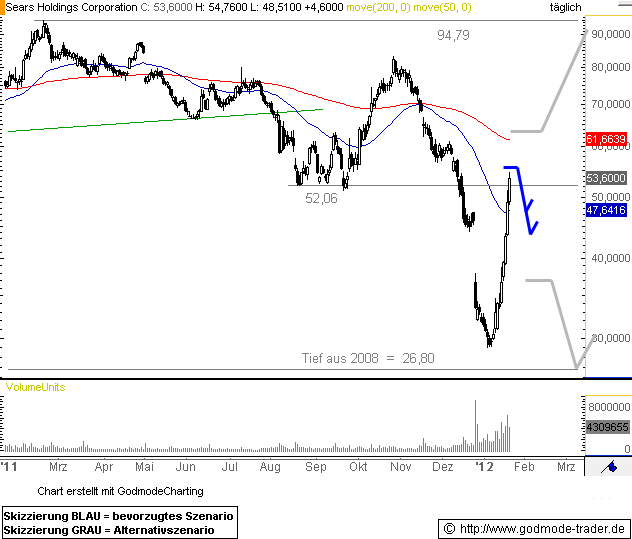 |
S | 41.97 |
02/02/12 | BoGo | |||||
| 01/23/12 | RIMM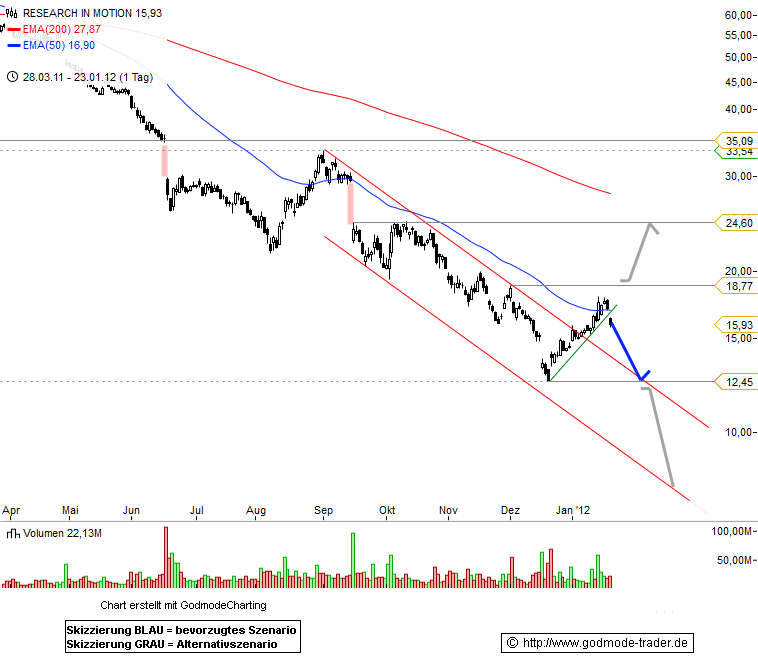 |
S | 17.21 |
02/02/12 | BoGo | |||||
| 01/20/12 | INTC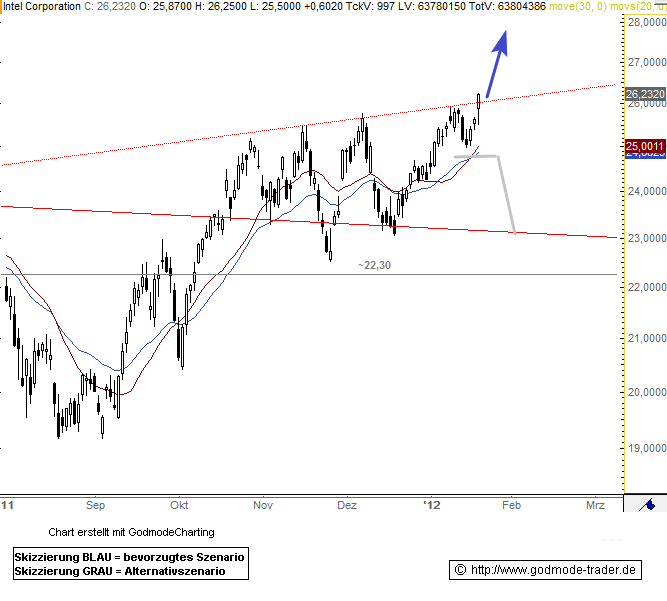 |
S | 26.49 |
02/02/12 | BoGo | |||||
| 01/20/12 | CSCO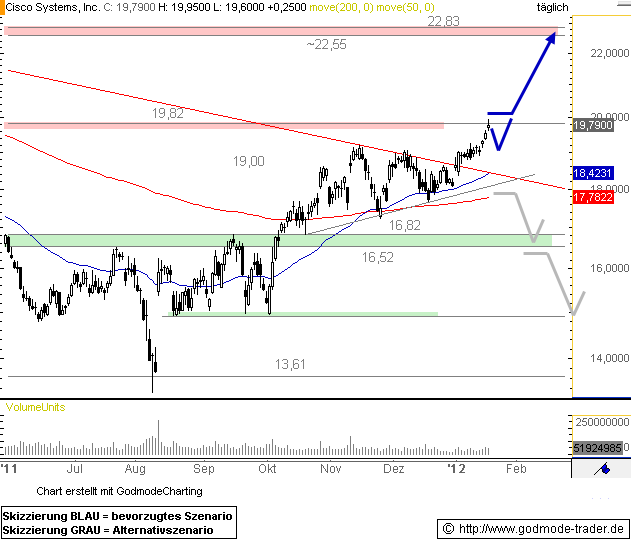 |
S | 19.80 |
02/02/12 | BoGo | |||||
| 01/20/12 | JPM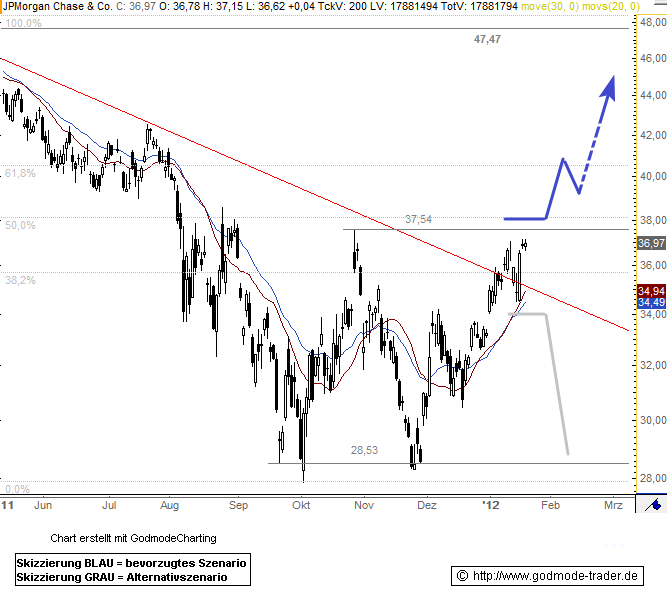 |
S | 37.55 |
02/02/12 | BoGo | |||||
| 01/20/12 | HPQ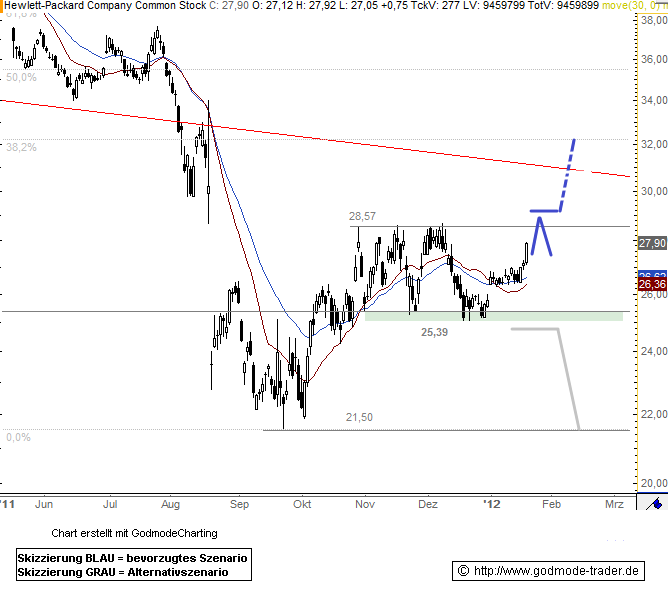 |
S | 28.50 |
02/02/12 | BoGo | |||||
| 01/20/12 | IBM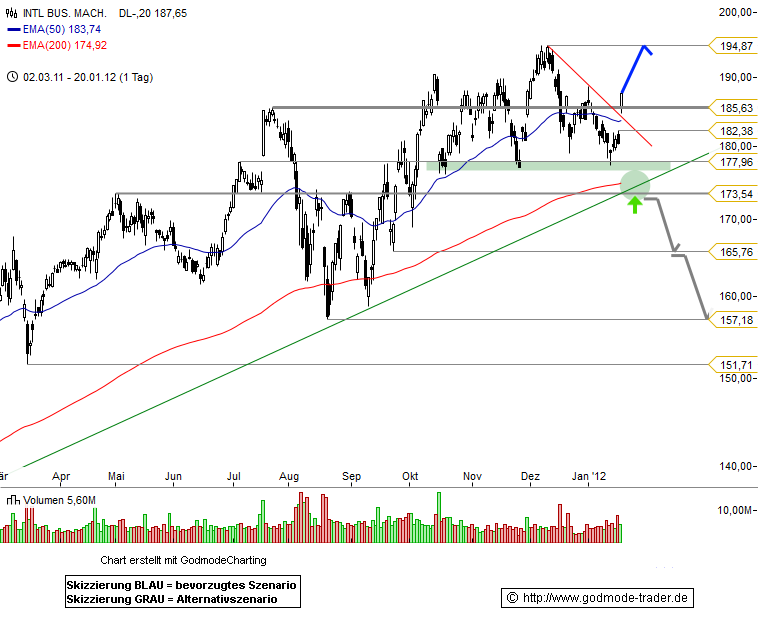 |
S | 191.53 |
02/02/12 | BoGo | |||||
| 01/20/12 | MSFT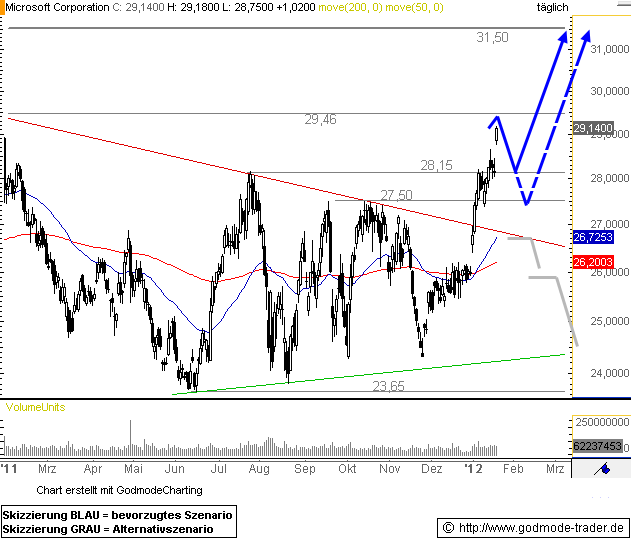 |
S | 29.95 |
02/02/12 | BoGo | |||||
| 01/20/12 | GE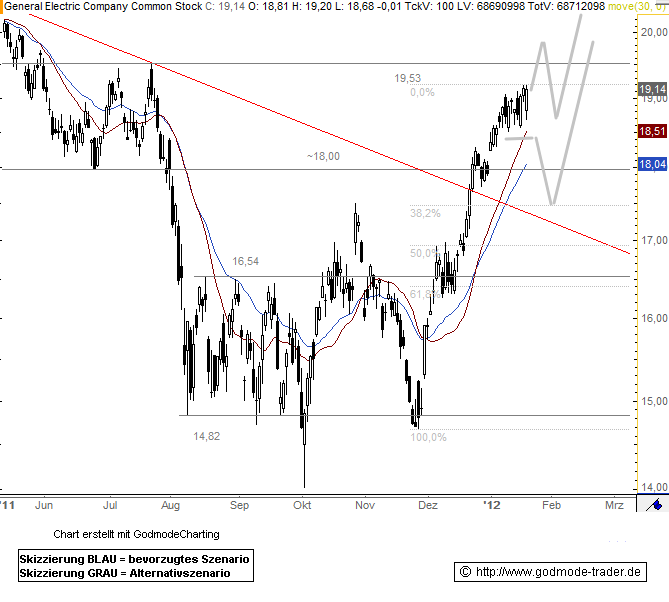 |
S | 18.75 |
02/02/12 | BoGo | |||||
| 01/19/12 | IBM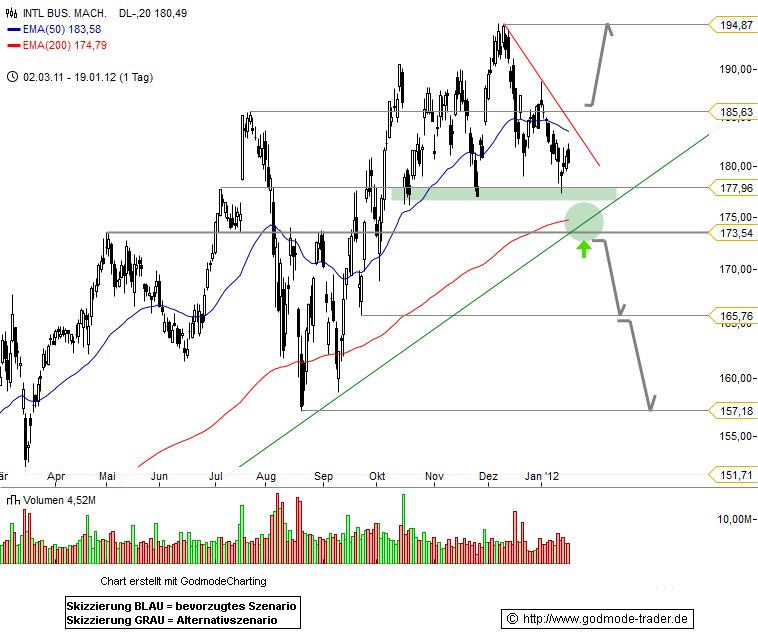 |
S | 191.53 |
02/02/12 | BoGo | |||||
| 01/19/12 | XOM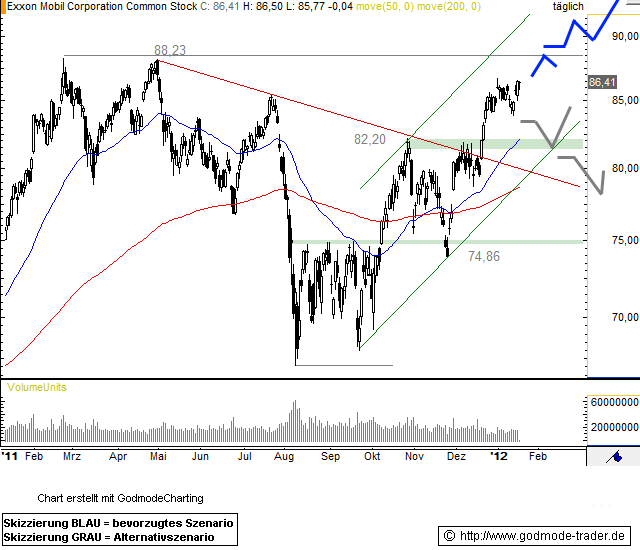 |
S | 83.53 |
02/02/12 | BoGo | |||||
| 01/19/12 | AMZN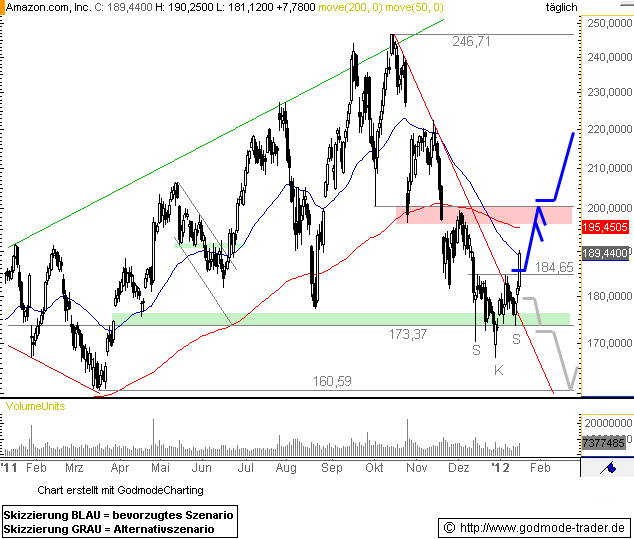 |
S | 181.72 |
02/02/12 | BoGo | |||||
| 01/19/12 | EBAY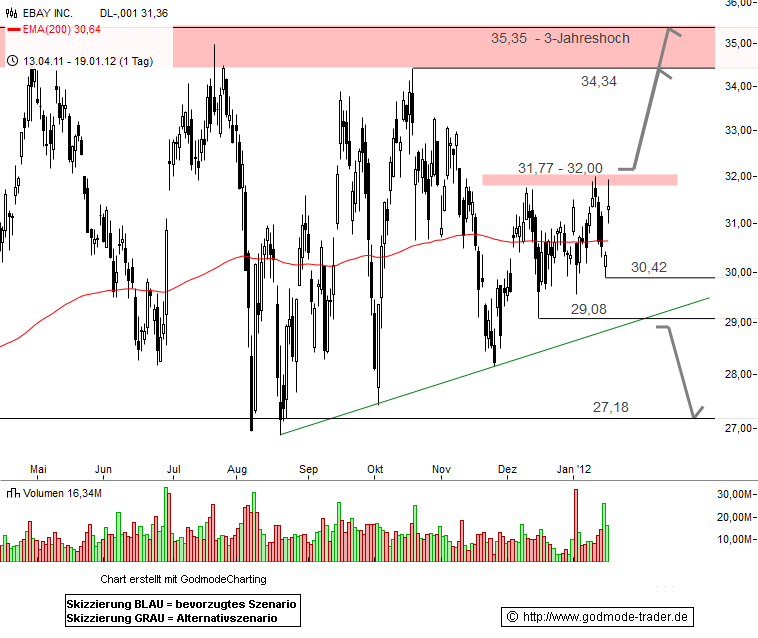 |
S | 32.70 |
02/02/12 | BoGo | |||||
| 01/19/12 | F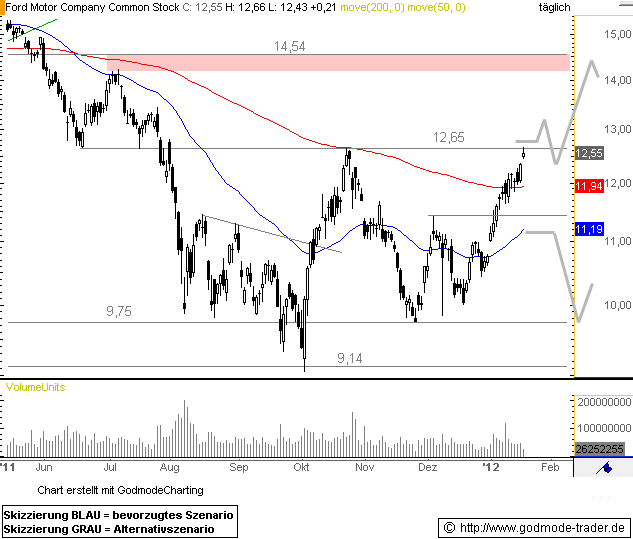 |
S | 12.26 |
02/02/12 | BoGo | |||||
| 01/19/12 | GOOG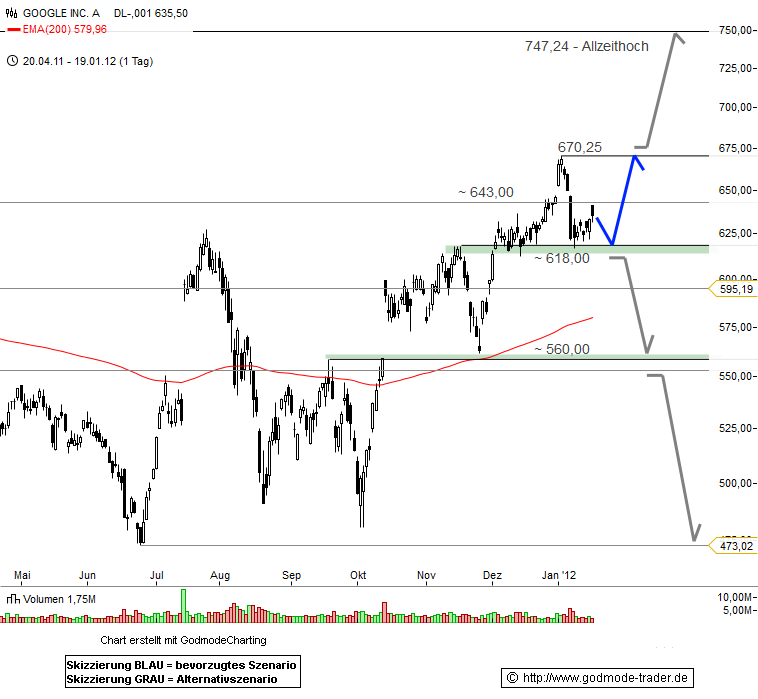 |
S | 585.11 |
02/02/12 | BoGo | |||||
| 01/18/12 | AAPL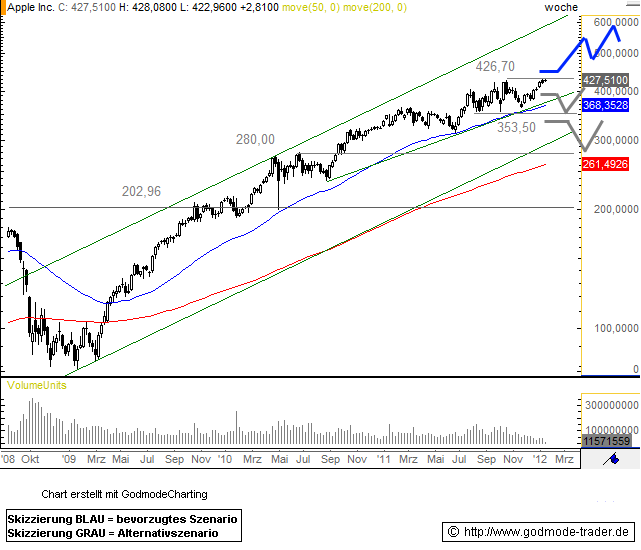 |
S | 455.12 |
02/02/12 | BoGo | |||||
| 01/18/12 | AMGN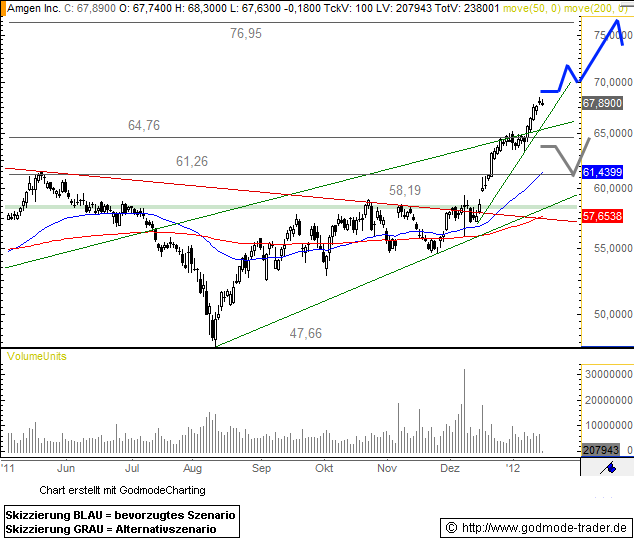 |
S | 69.62 |
02/02/12 | BoGo | |||||
| 01/18/12 | 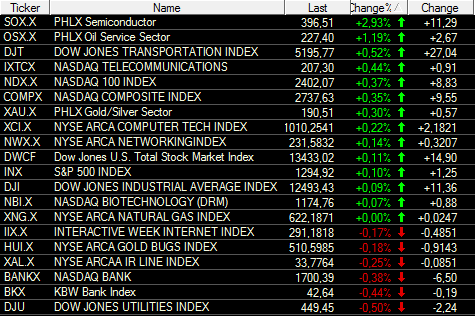 |
S | BoGo | |||||||
| 01/18/12 | KFT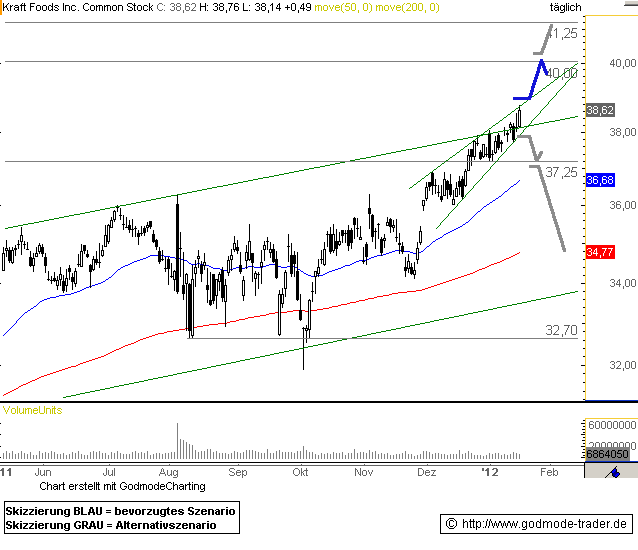 |
S | 38.58 |
02/02/12 | BoGo | |||||
| 01/18/12 | WMT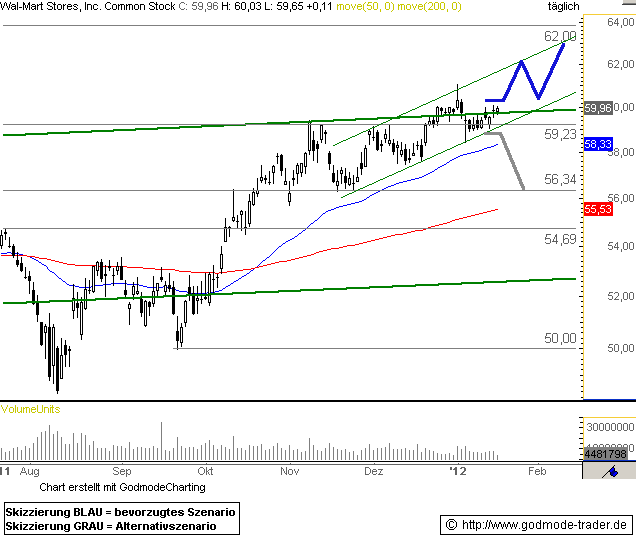 |
S | 61.94 |
02/02/12 | BoGo | |||||
| 01/18/12 | DD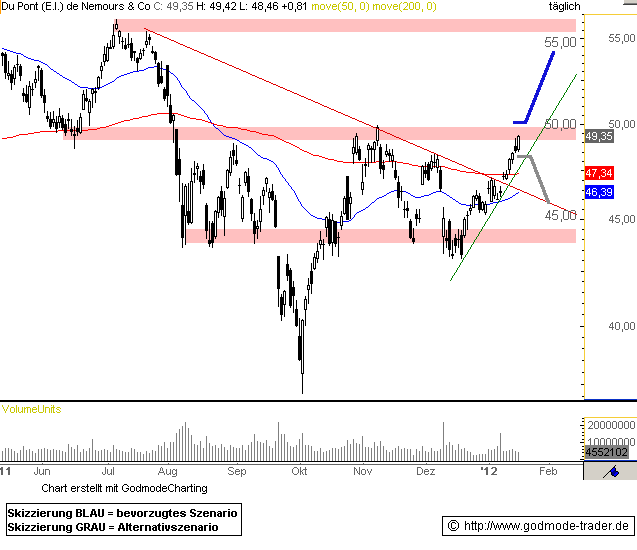 |
S | 51.40 |
02/02/12 | BoGo | |||||
| 01/17/12 | CAT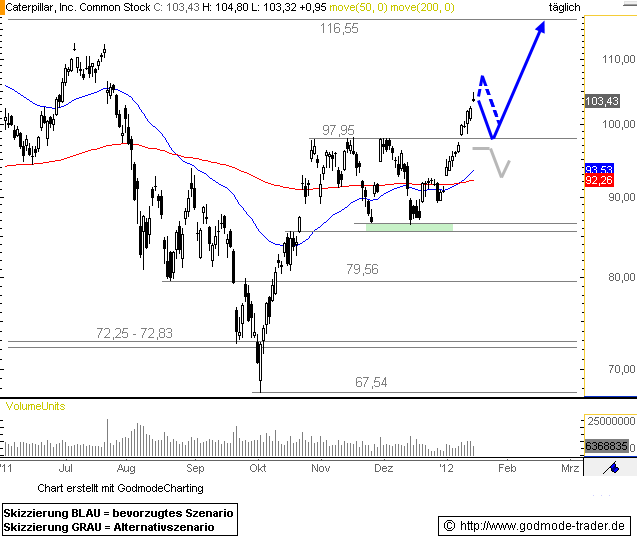 |
S | 110.33 |
02/02/12 | BoGo | |||||
| 01/17/12 | MSFT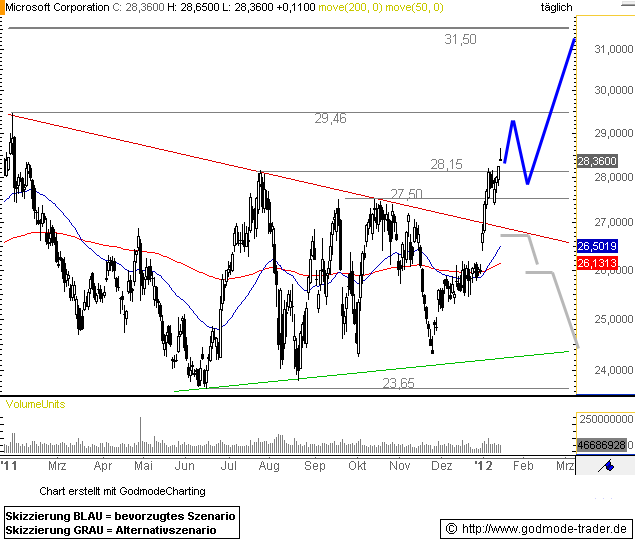 |
S | 29.95 |
02/02/12 | BoGo | |||||
| 01/13/12 | BA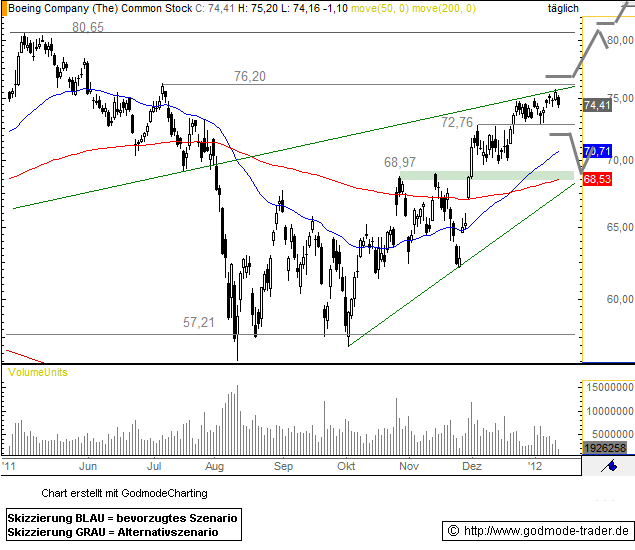 |
S | 75.22 |
02/02/12 | BoGo | |||||
| 01/13/12 | UTX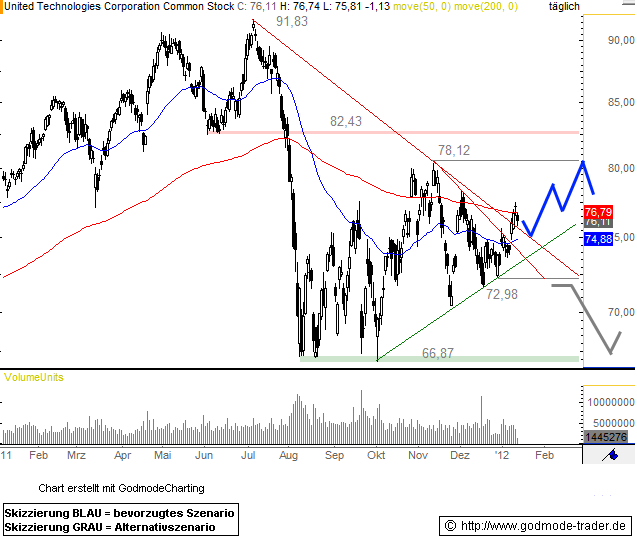 |
S | 80.02 |
02/02/12 | BoGo | |||||
| 01/13/12 | CMCSA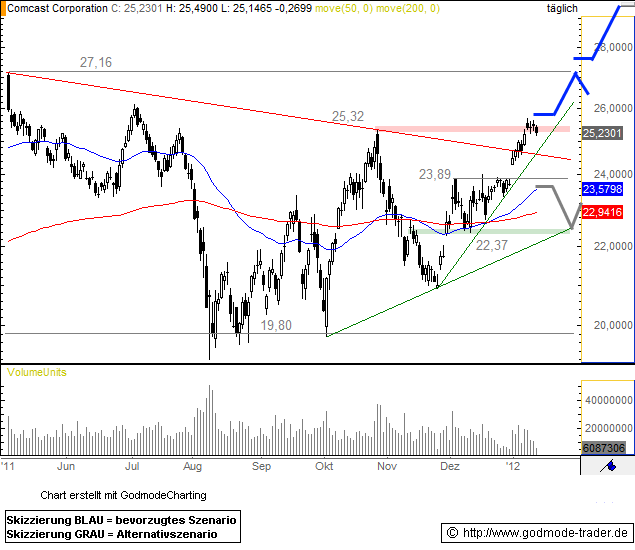 |
S | 26.69 |
02/02/12 | BoGo | |||||
| 01/13/12 | EBAY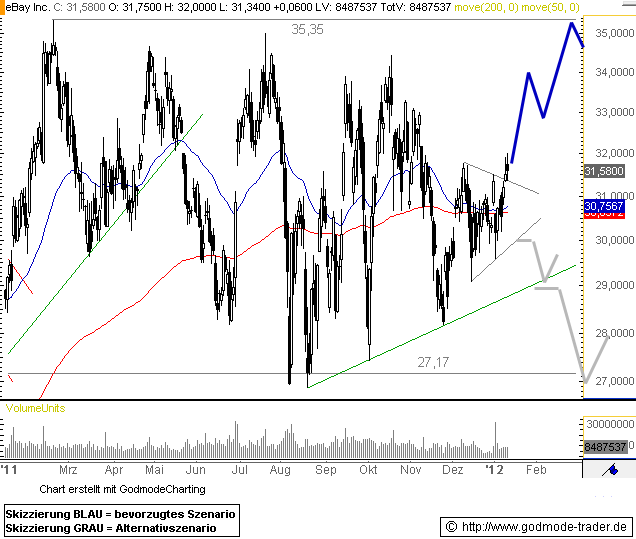 |
S | 32.70 |
02/02/12 | BoGo | |||||
| 01/13/12 | STX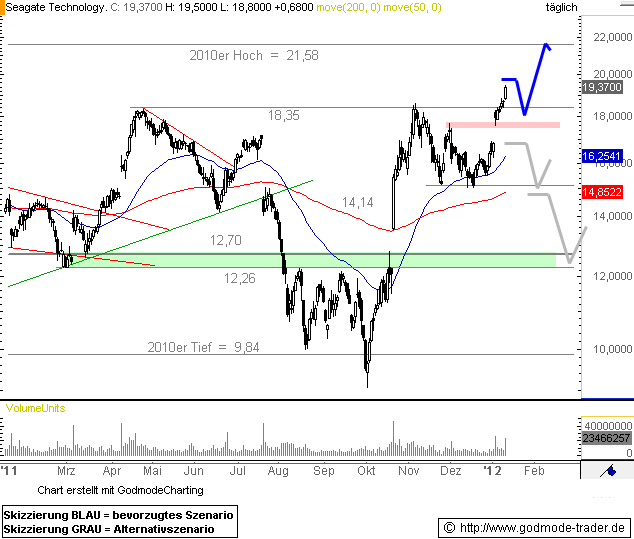 |
S | 25.75 |
02/02/12 | BoGo | |||||
| 01/12/12 | HPQ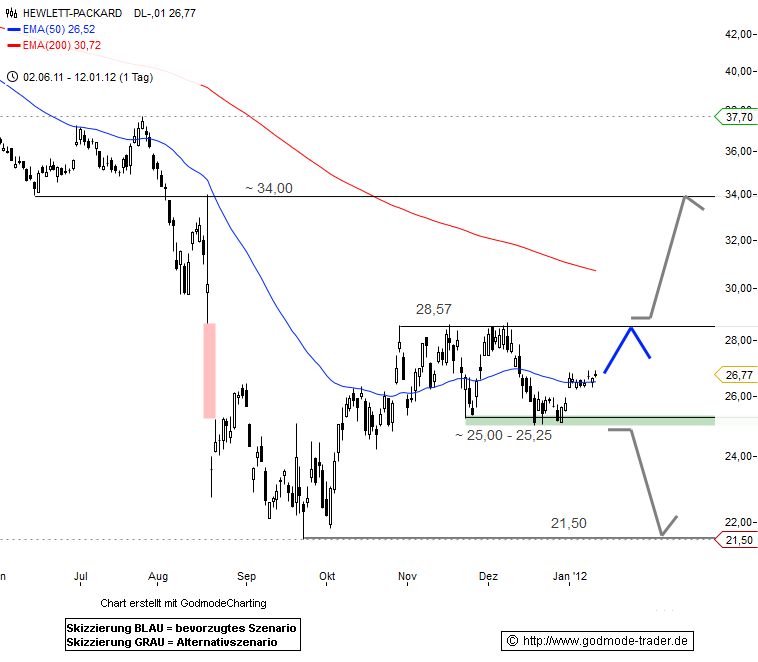 |
S | 28.50 |
02/02/12 | BoGo | |||||
| 01/12/12 | PFE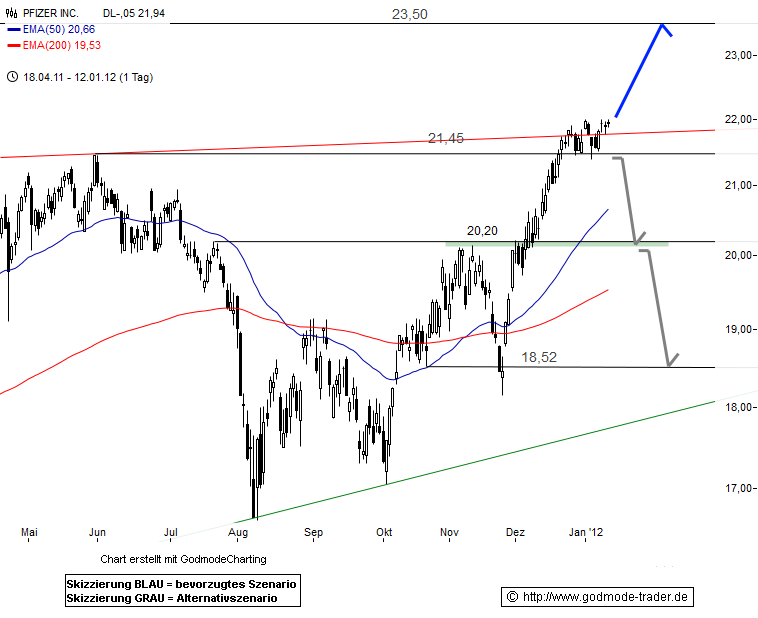 |
S | 21.11 |
02/02/12 | BoGo | |||||
| 01/12/12 | AXP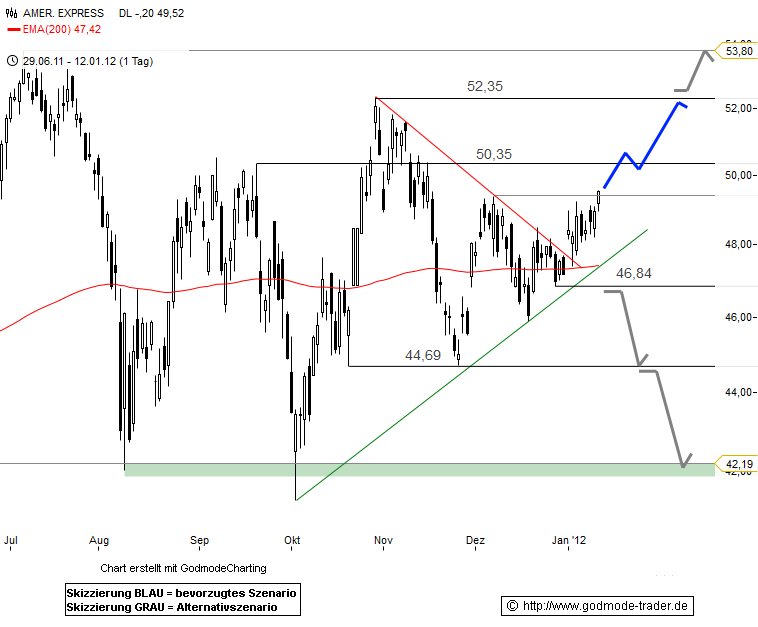 |
S | 51.16 |
02/02/12 | BoGo | |||||
| 01/12/12 | KO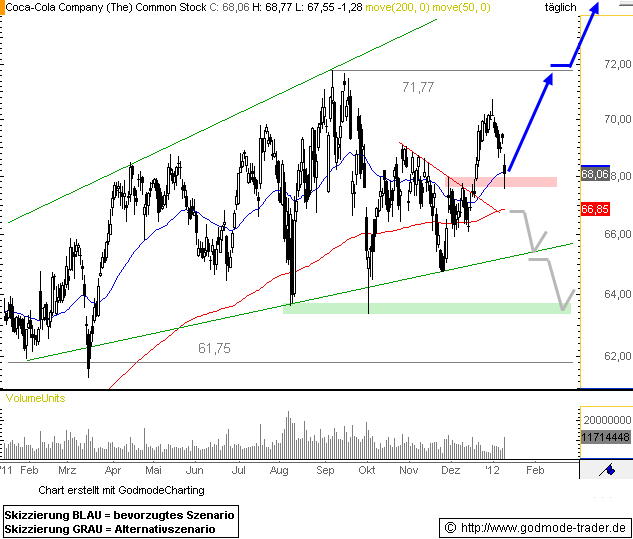 |
S | 67.83 |
02/02/12 | BoGo | |||||
| 01/12/12 | FSLR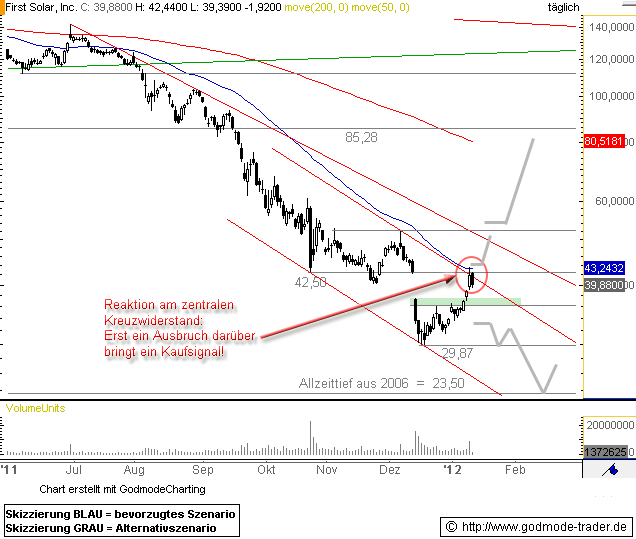 |
S | 44.74 |
02/02/12 | BoGo | |||||
| 01/11/12 | GRMN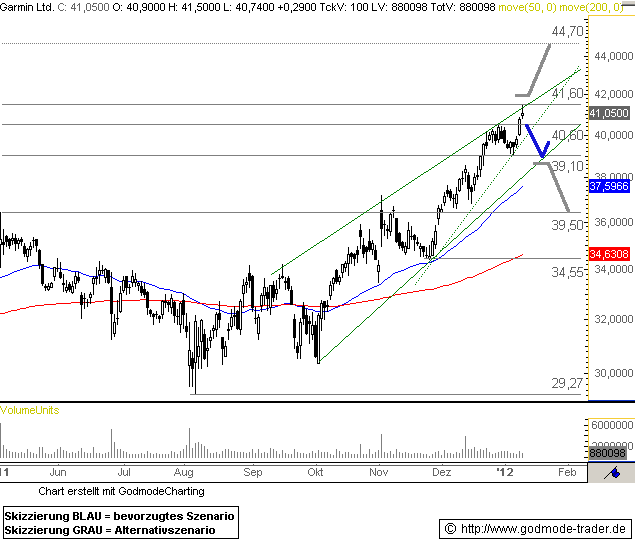 |
S | 43.53 |
02/02/12 | BoGo | |||||
| 01/11/12 | CVX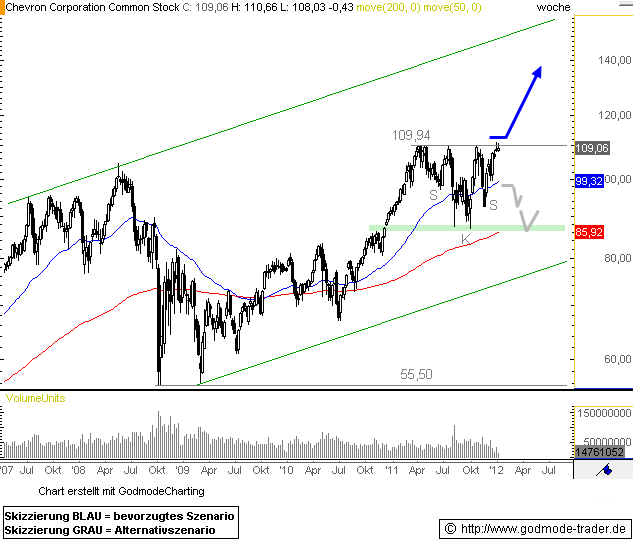 |
S | 103.69 |
02/02/12 | BoGo | |||||
| 01/11/12 | MMM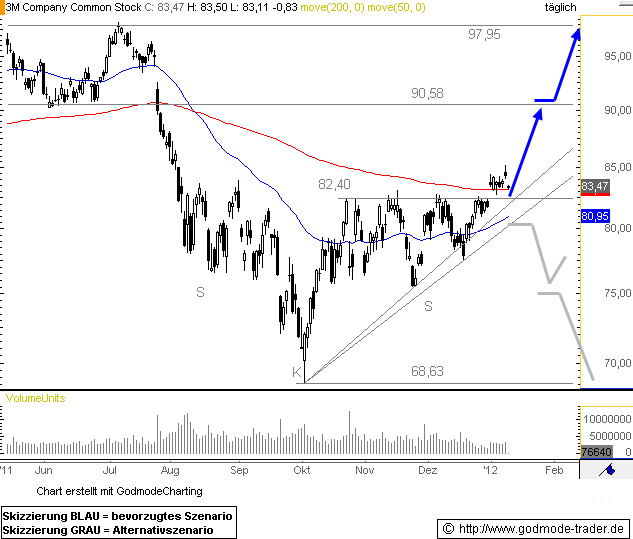 |
S | 87.43 |
02/02/12 | BoGo | |||||
| 01/11/12 | IBM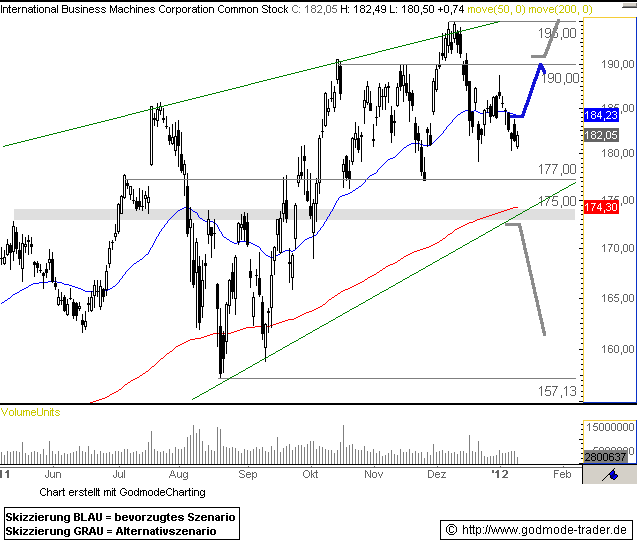 |
S | 191.53 |
02/02/12 | BoGo | |||||
| 01/11/12 | INTC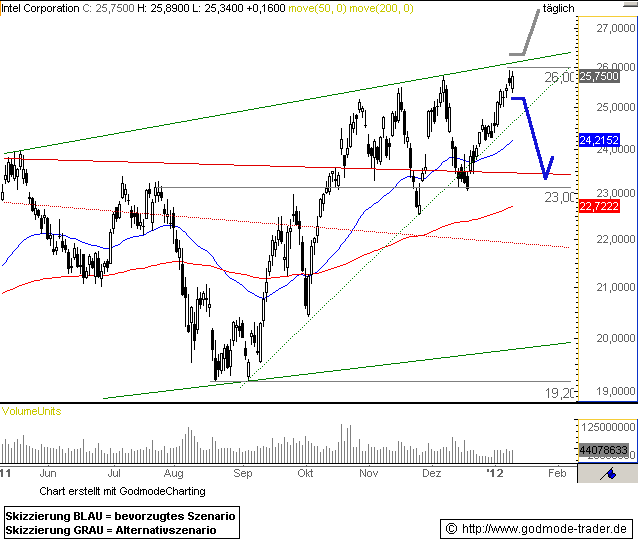 |
S | 26.49 |
02/02/12 | BoGo | |||||
| 01/11/12 | AMZN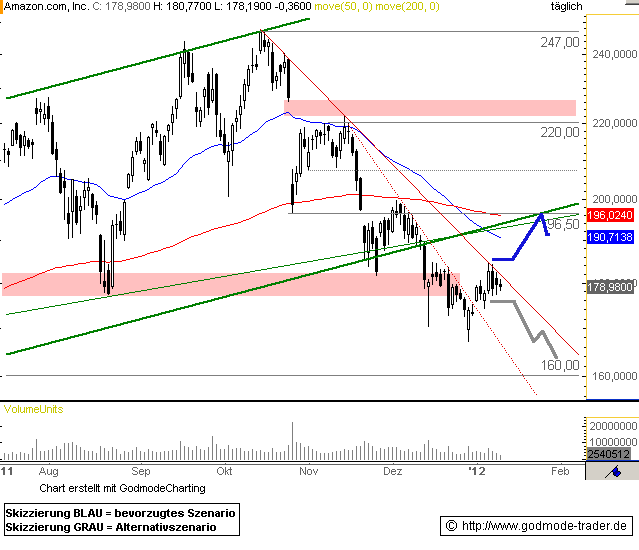 |
S | 181.72 |
02/02/12 | BoGo | |||||
| 01/10/12 | CAT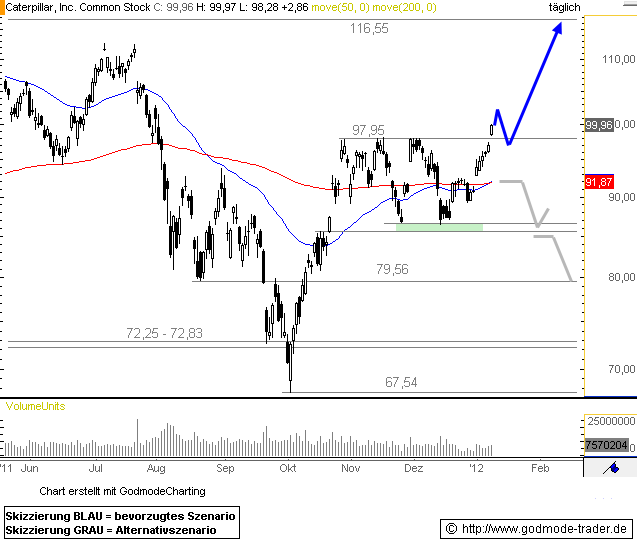 |
S | 110.33 |
02/02/12 | BoGo | |||||
| 01/10/12 | 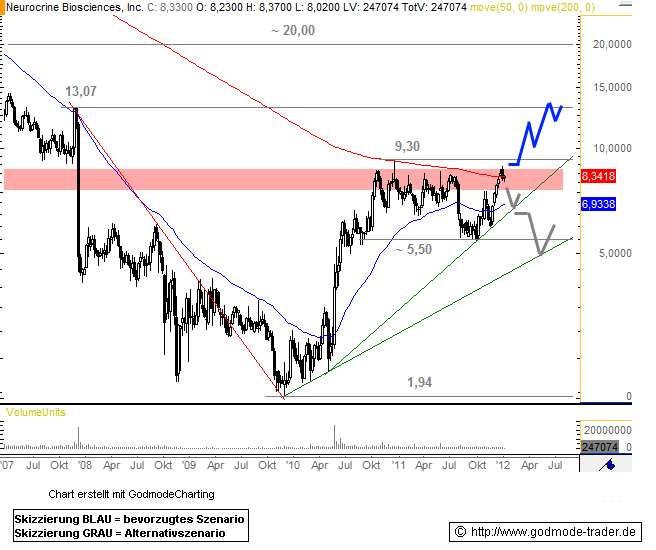 |
S | BoGo | |||||||
| 01/09/12 | AA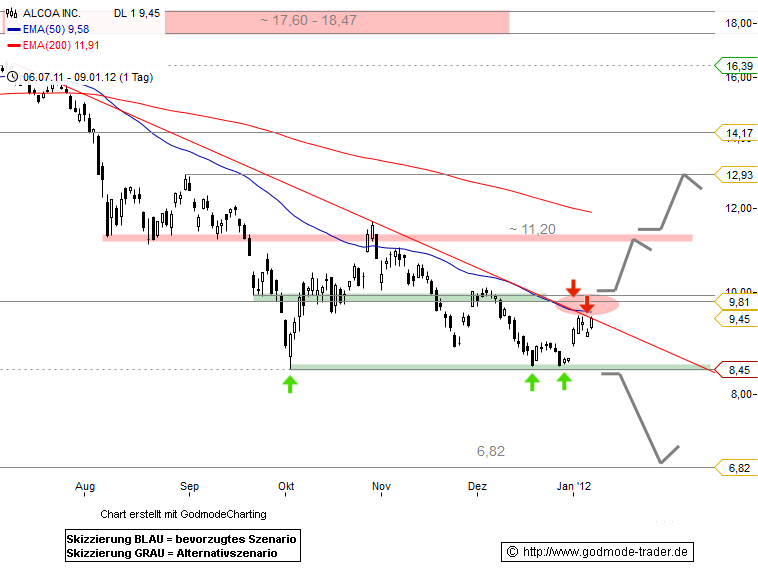 |
S | 10.42 |
02/02/12 | BoGo | |||||
| 01/09/12 | MSFT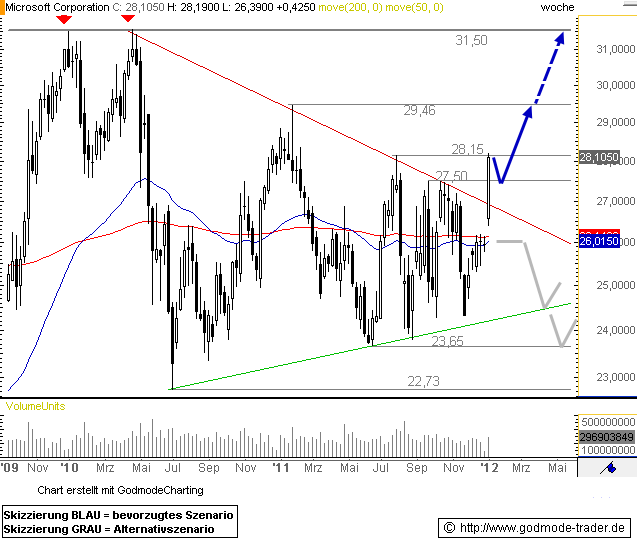 |
S | 29.95 |
02/02/12 | BoGo | |||||
| 01/09/12 | AAPL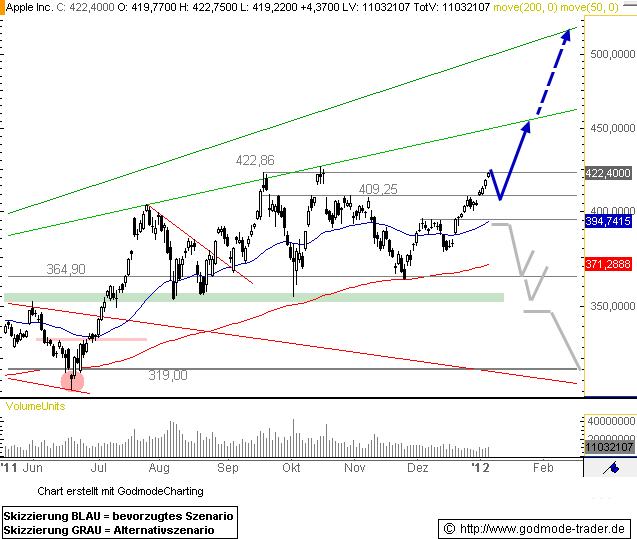 |
S | 455.12 |
02/02/12 | BoGo | |||||
| 01/09/12 | GOOG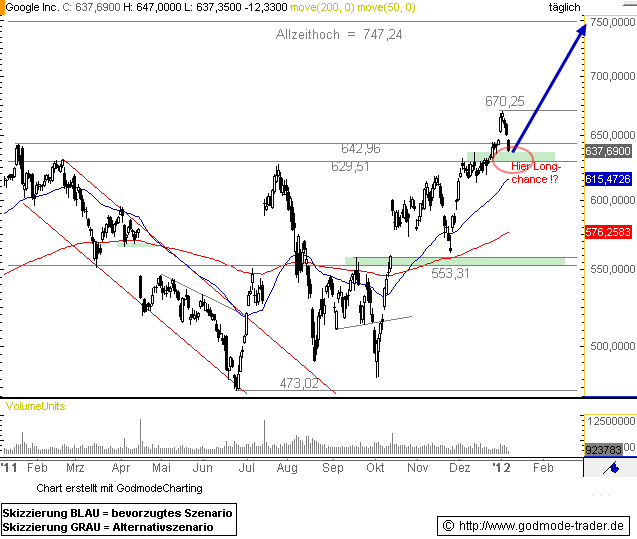 |
S | 585.11 |
02/02/12 | BoGo | |||||
| 01/06/12 | T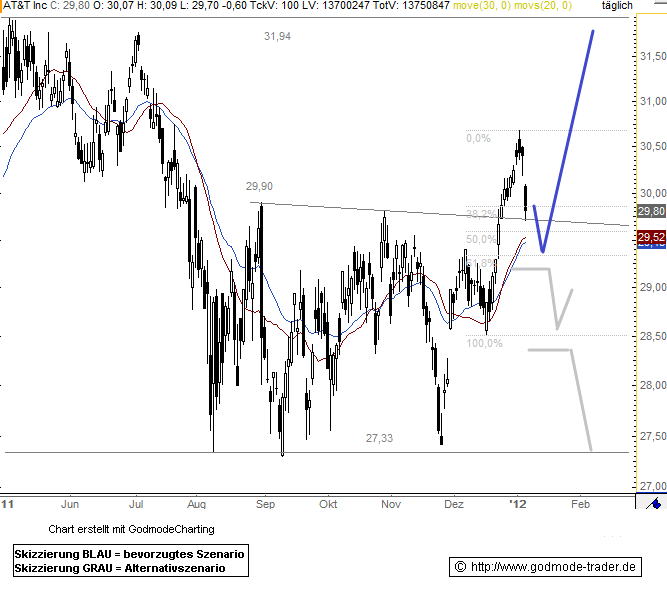 |
S | 29.79 |
02/02/12 | BoGo | |||||
| 01/06/12 | VZ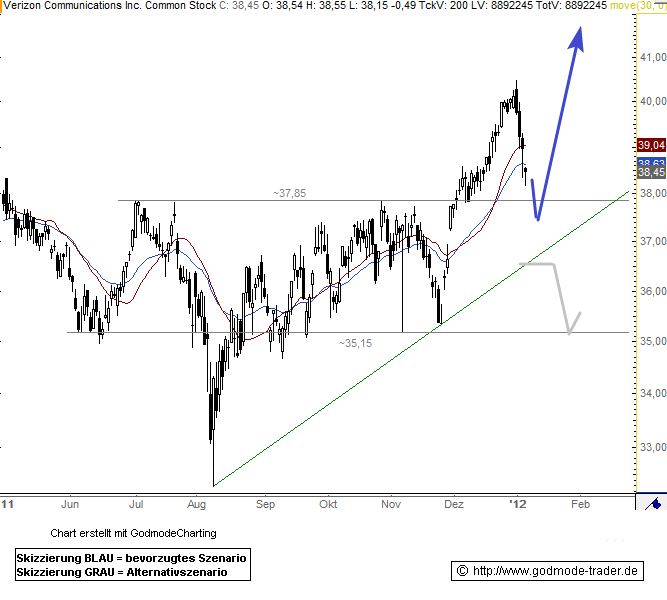 |
S | 37.56 |
02/02/12 | BoGo | |||||
| 01/06/12 | CVX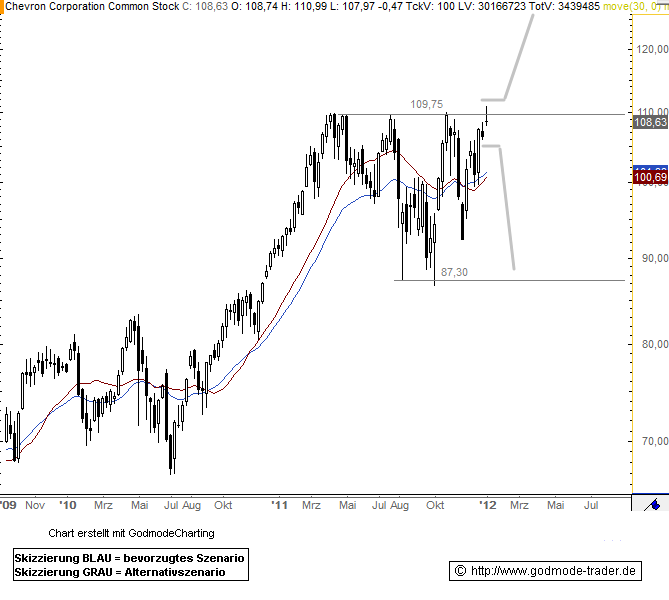 |
S | 103.69 |
02/02/12 | BoGo | |||||
| 01/06/12 | CSCO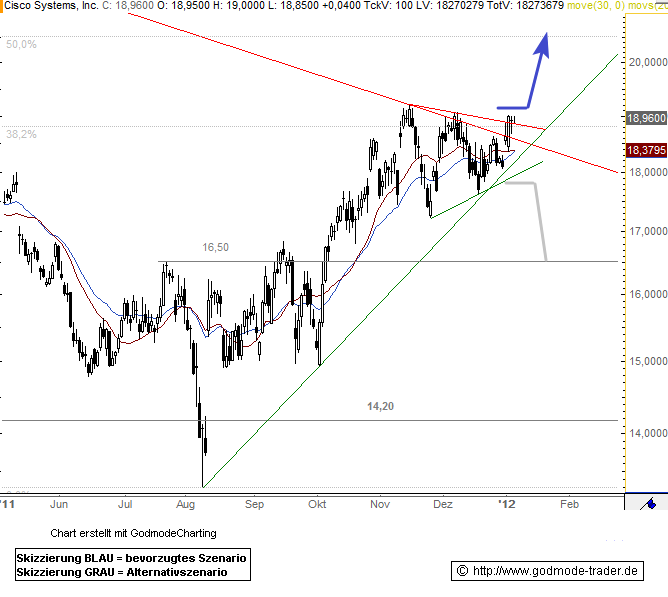 |
S | 19.80 |
02/02/12 | BoGo | |||||
| 01/06/12 | HD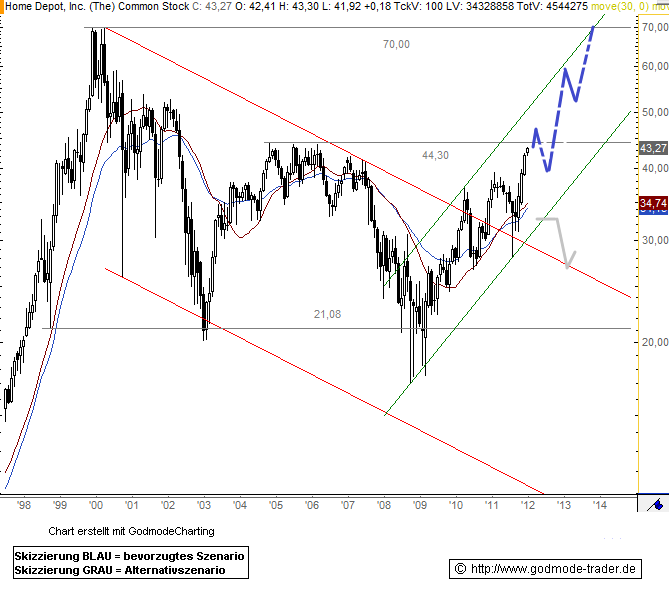 |
S | 44.46 |
02/02/12 | BoGo | |||||
| 01/06/12 | CAT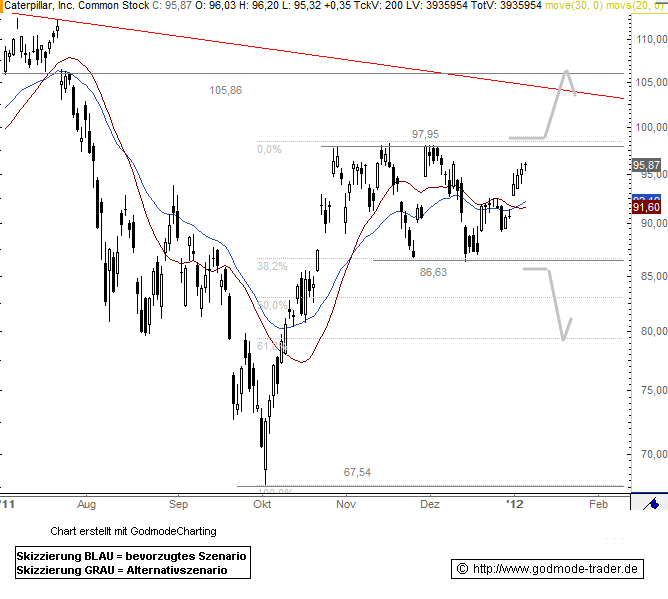 |
S | 110.33 |
02/02/12 | BoGo | |||||
| 01/06/12 | WMT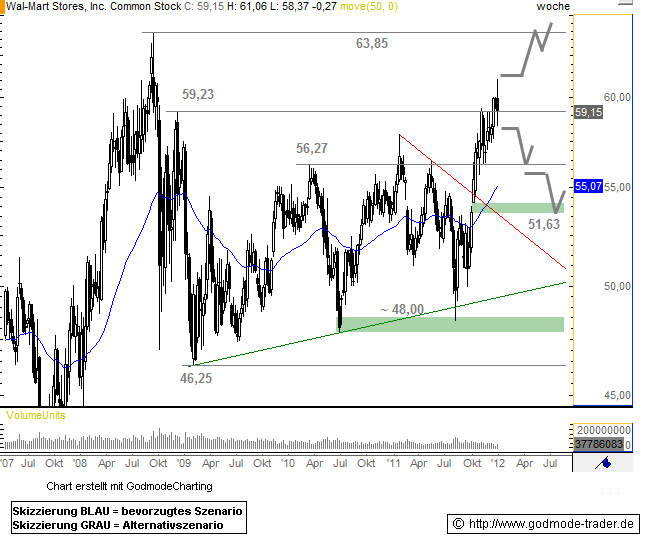 |
S | 61.94 |
02/02/12 | BoGo | |||||
| 01/05/12 | BA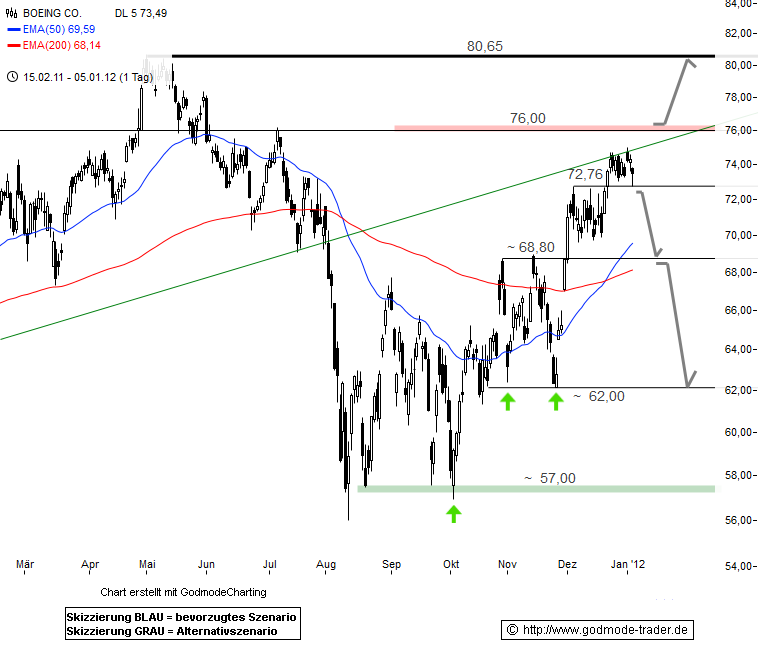 |
S | 75.22 |
02/02/12 | BoGo | |||||
| 01/05/12 | BAC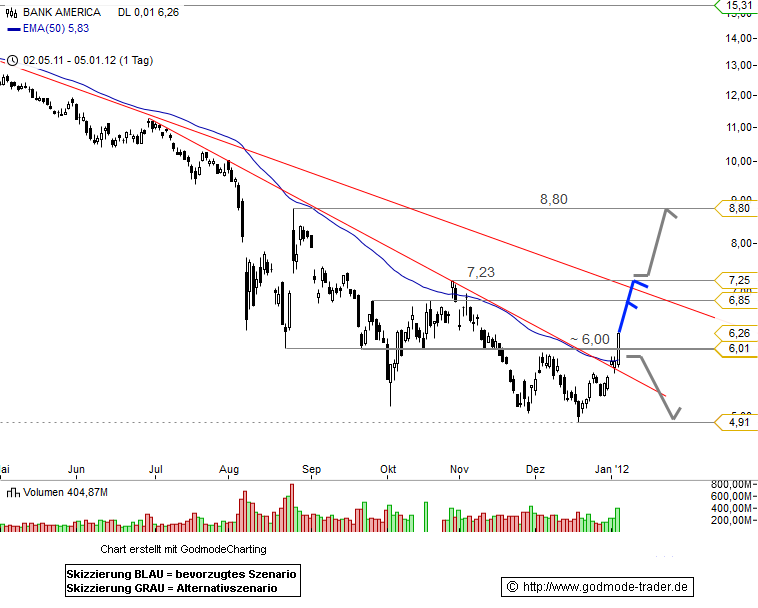 |
S | 7.45 |
02/02/12 | BoGo | |||||
| 01/05/12 | MON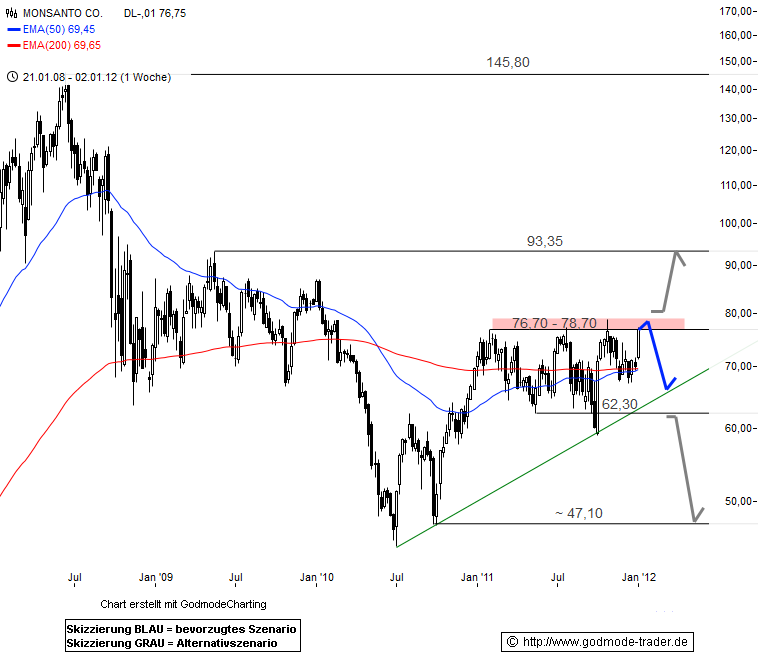 |
S | 82.13 |
02/02/12 | BoGo | |||||
| 12/23/11 | F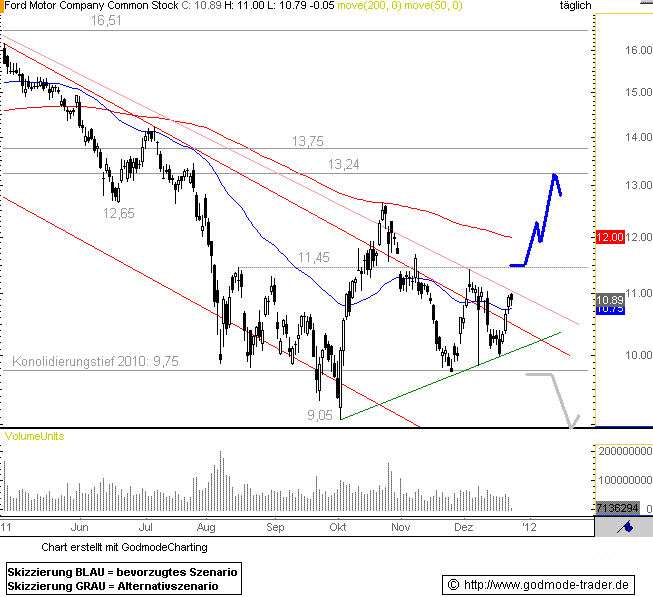 |
S | 12.26 |
02/02/12 | BoGo | |||||
| 12/23/11 | KO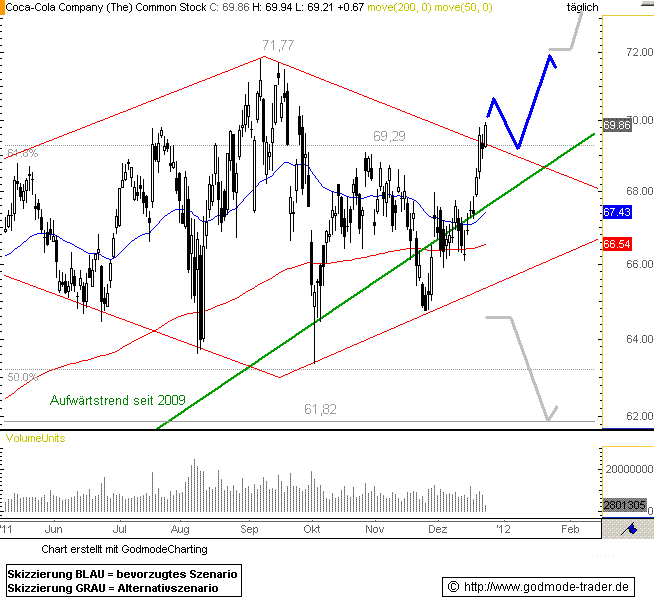 |
S | 67.83 |
02/02/12 | BoGo | |||||
| 12/22/11 | AAPL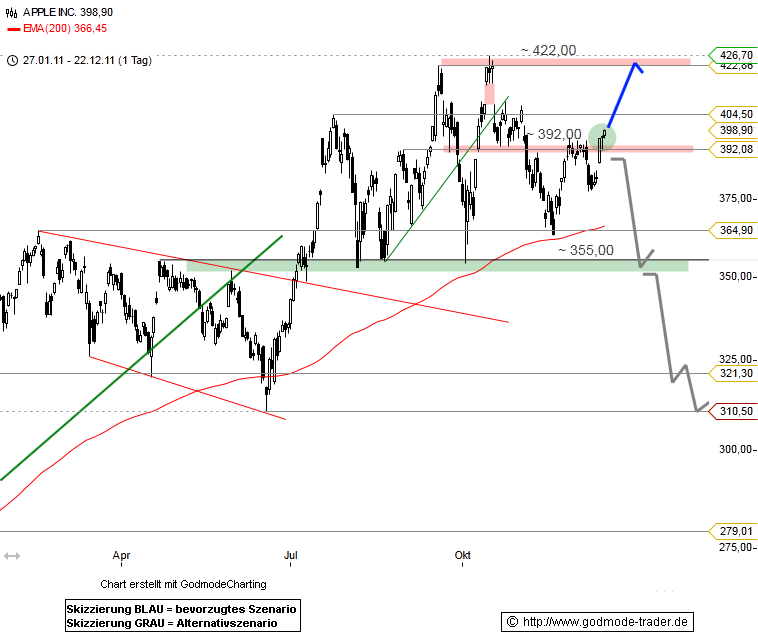 |
S | 455.12 |
02/02/12 | BoGo | |||||
| 12/22/11 | AMGN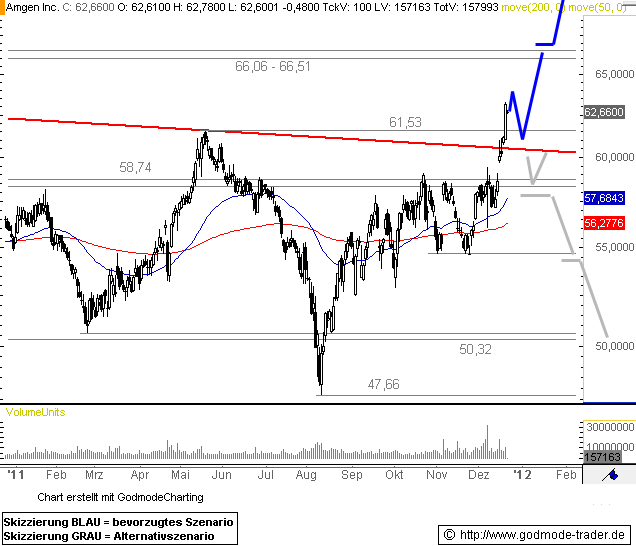 |
S | 69.62 |
02/02/12 | BoGo | |||||
| 12/21/11 | DIA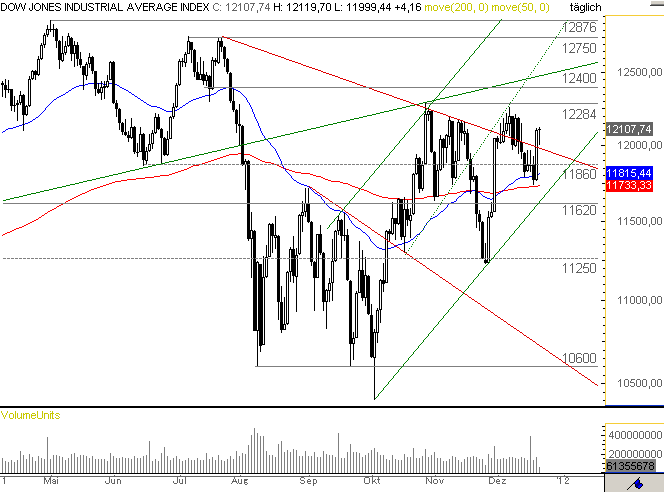 |
S | 126.84 |
02/02/12 | BoGo | |||||
| 12/21/11 | WMT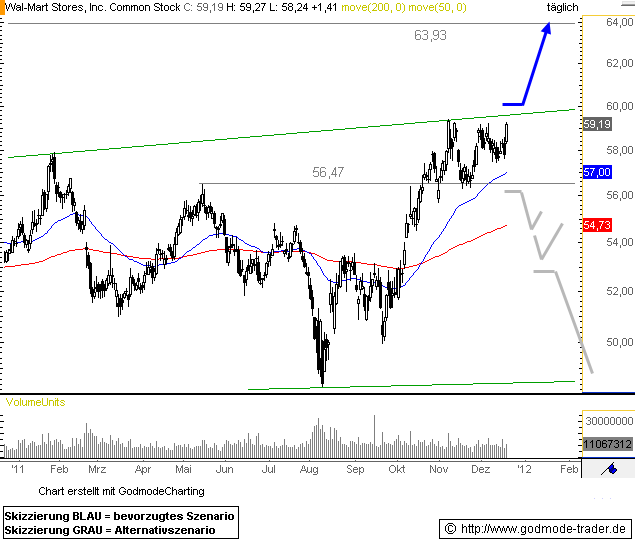 |
S | 61.94 |
02/02/12 | BoGo | |||||
| 12/21/11 | XOM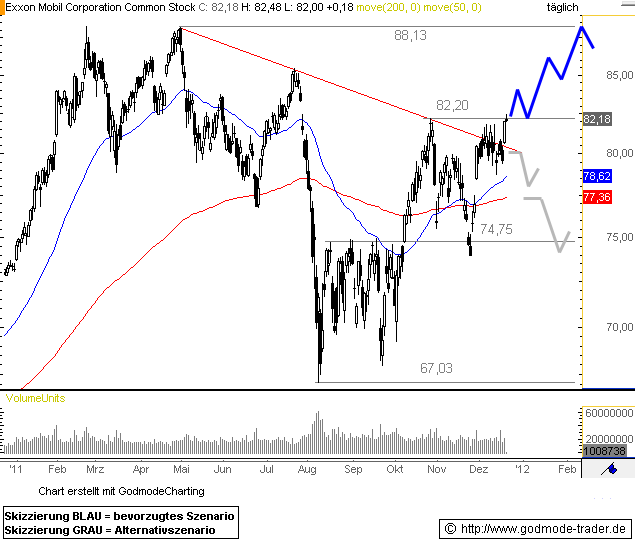 |
S | 83.53 |
02/02/12 | BoGo | |||||
| 12/21/11 | AA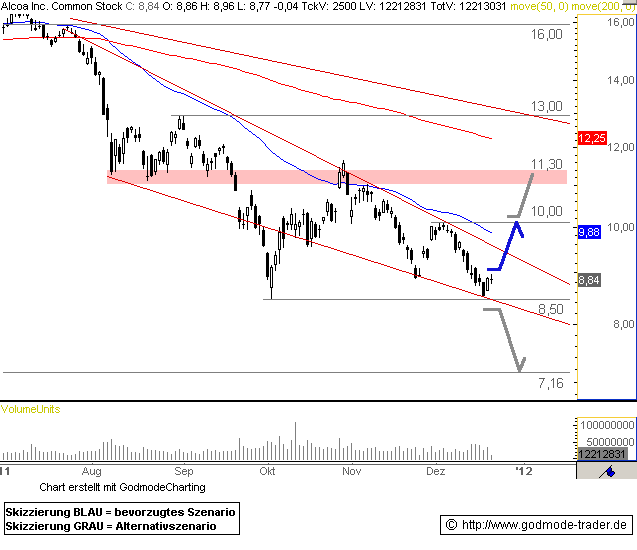 |
S | 10.42 |
02/02/12 | BoGo | |||||
| 12/21/11 | RIMM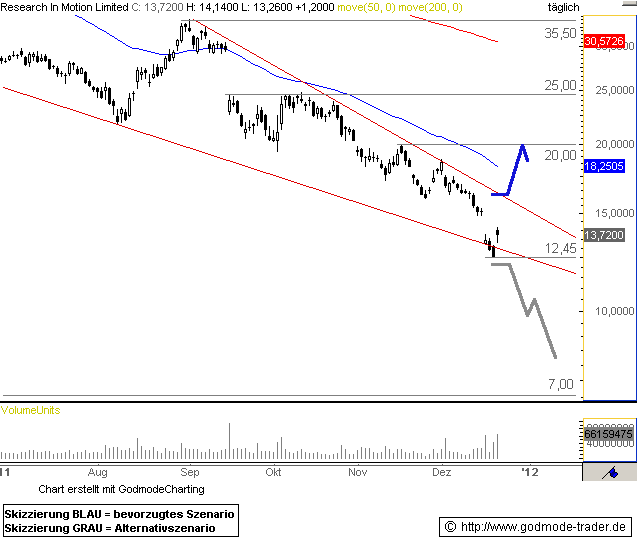 |
S | 17.21 |
02/02/12 | BoGo | |||||
| 12/20/11 | CAT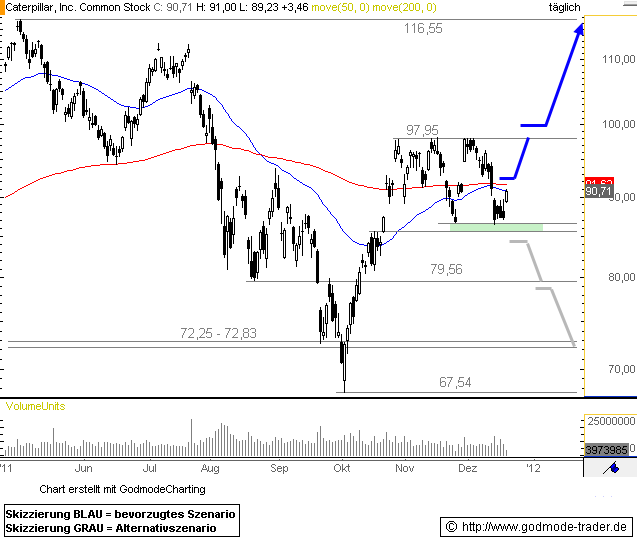 |
S | 110.33 |
02/02/12 | BoGo | |||||
| 12/20/11 | T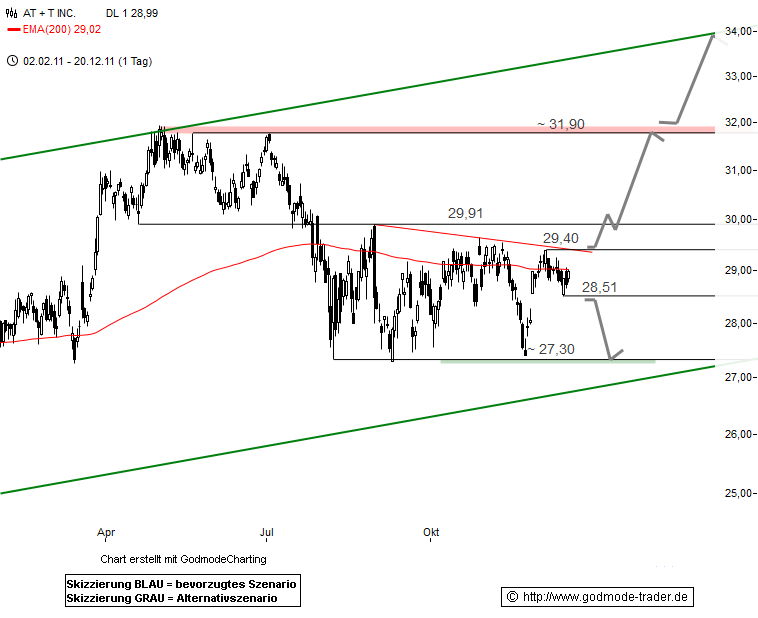 |
S | 29.79 |
02/02/12 | BoGo | |||||
| 12/20/11 | PFE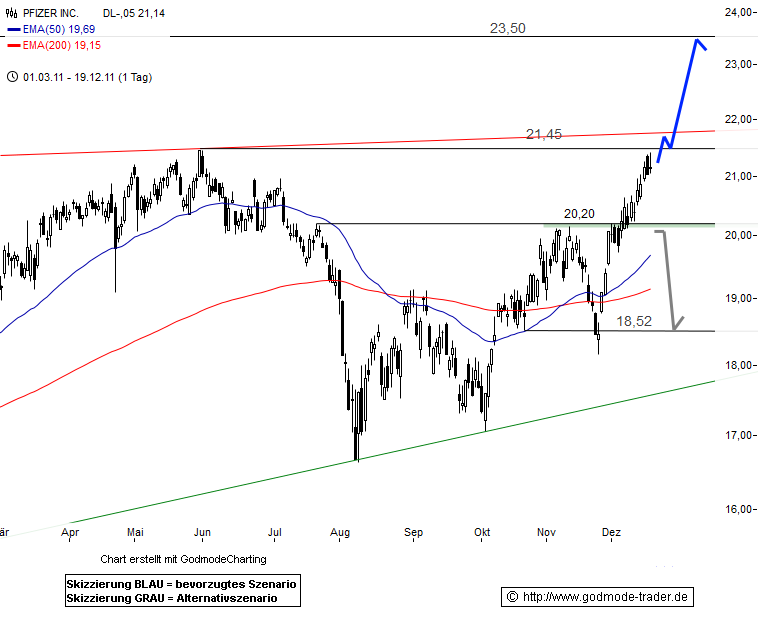 |
S | 21.11 |
02/02/12 | BoGo | |||||
| 12/19/11 | BAC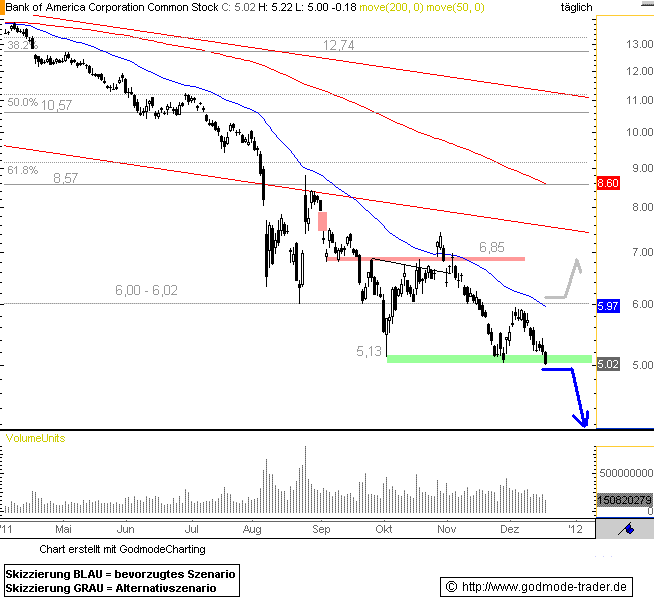 |
S | 7.45 |
02/02/12 | BoGo | |||||
| 12/19/11 | KO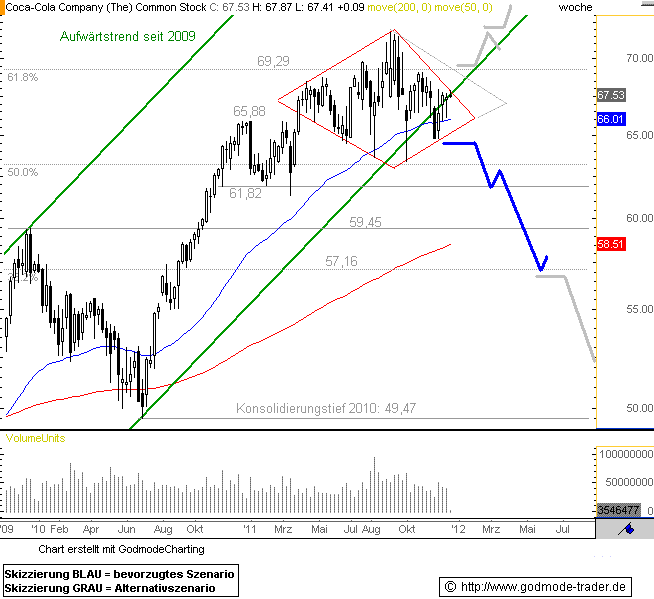 |
S | 67.83 |
02/02/12 | BoGo | |||||
| 12/19/11 | DD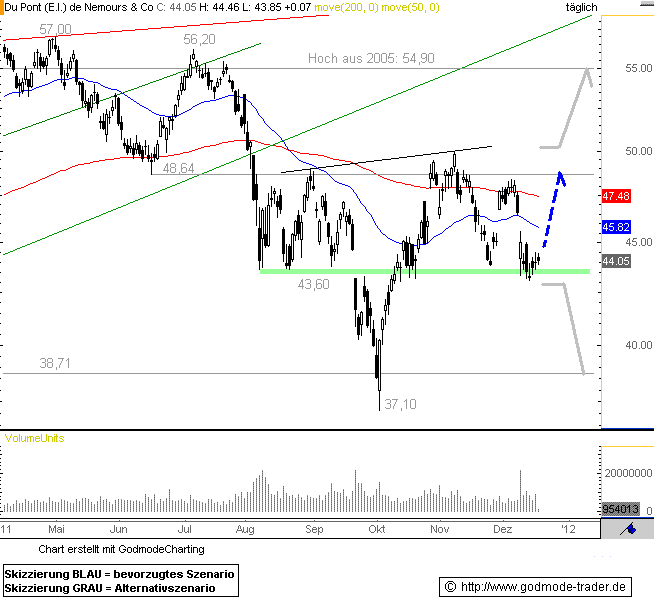 |
S | 51.40 |
02/02/12 | BoGo | |||||
| 12/19/11 | DIA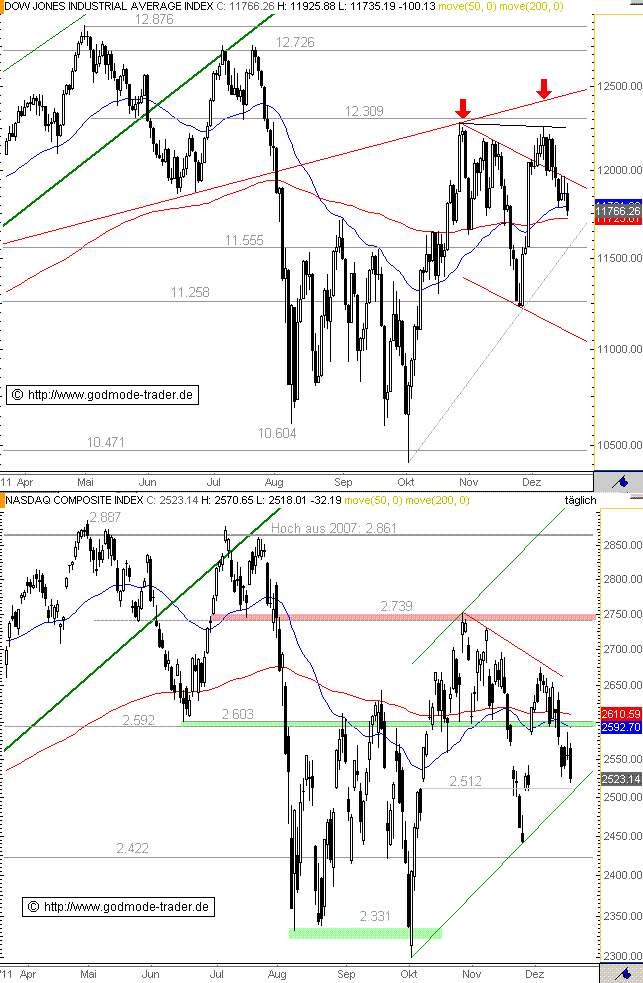 |
S | 126.84 |
02/02/12 | BoGo | |||||
| 12/16/11 | BAC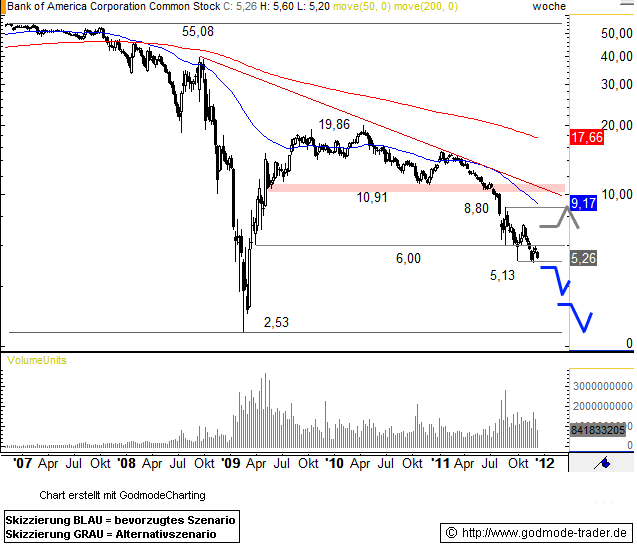 |
S | 7.45 |
02/02/12 | BoGo | |||||
| 12/16/11 | SPY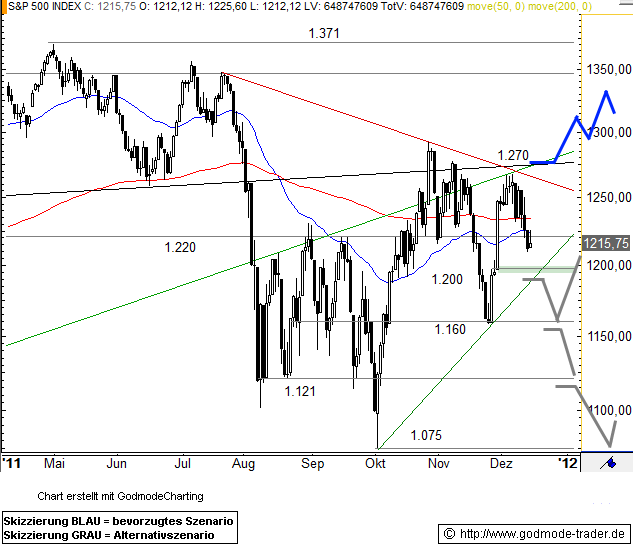 |
S | 132.68 |
02/02/12 | BoGo | |||||
| 12/16/11 | AMZN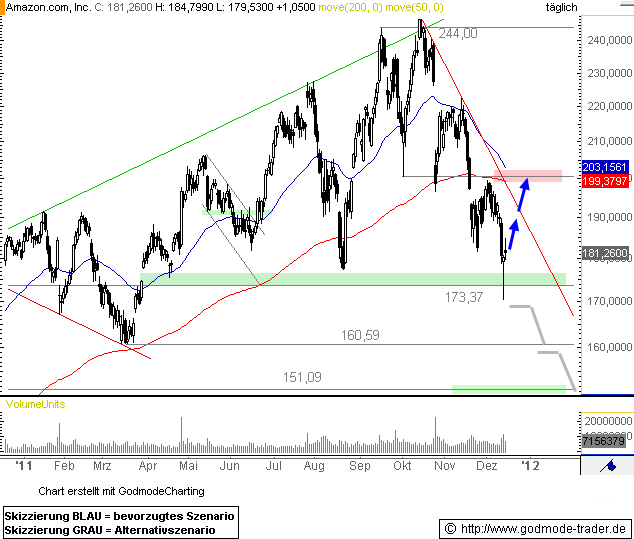 |
S | 181.72 |
02/02/12 | BoGo | |||||
| 12/16/11 | GOOG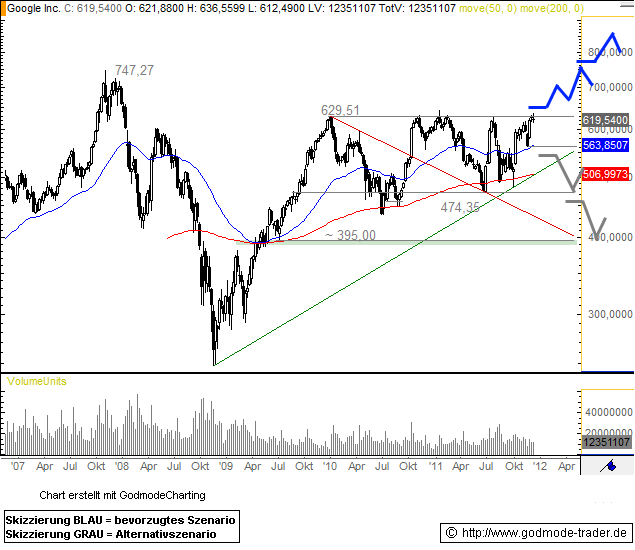 |
S | 585.11 |
02/02/12 | BoGo | |||||
| 12/15/11 | AA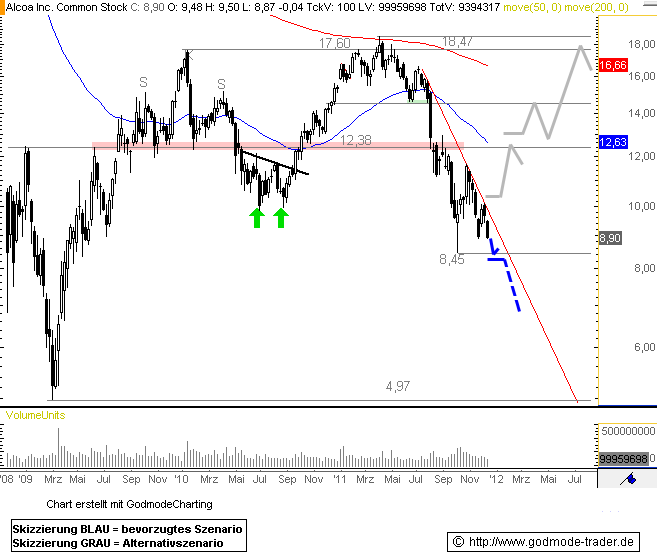 |
S | 10.42 |
02/02/12 | BoGo | |||||
| 12/15/11 | DIS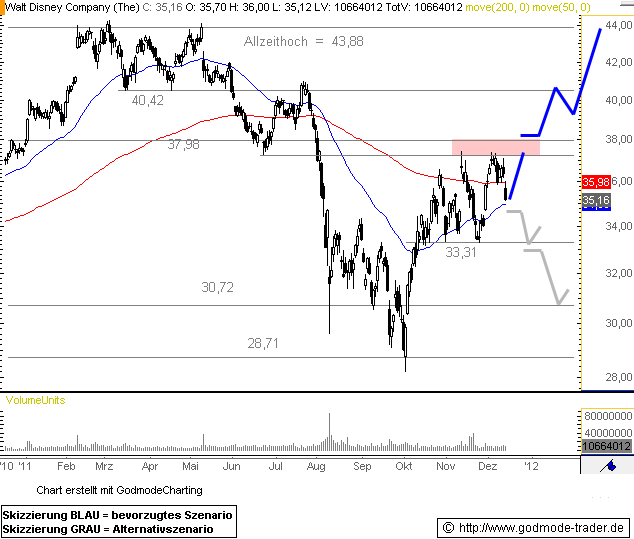 |
S | 38.91 |
02/02/12 | BoGo | |||||
| 12/15/11 | VZ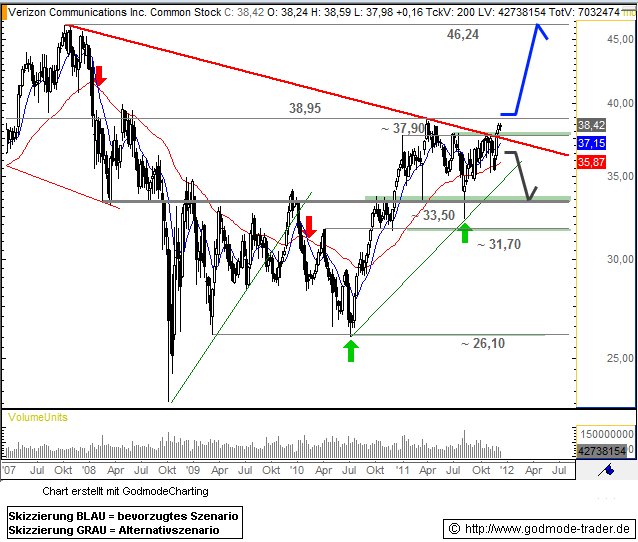 |
S | 37.56 |
02/02/12 | BoGo | |||||
| 12/15/11 | RIMM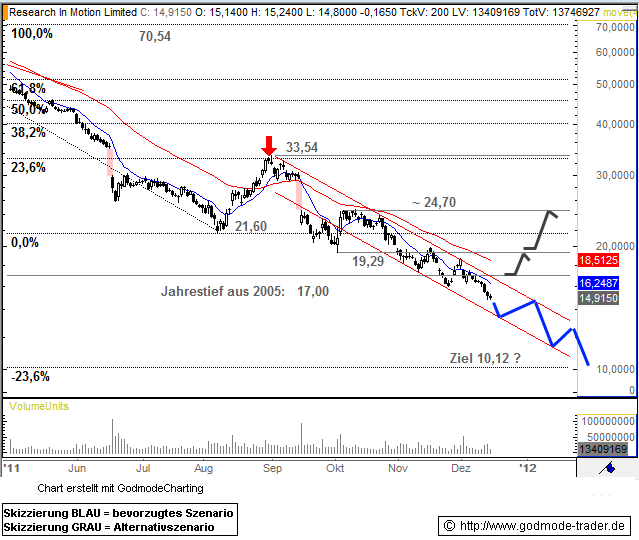 |
S | 17.21 |
02/02/12 | BoGo | |||||
| 12/14/11 | GE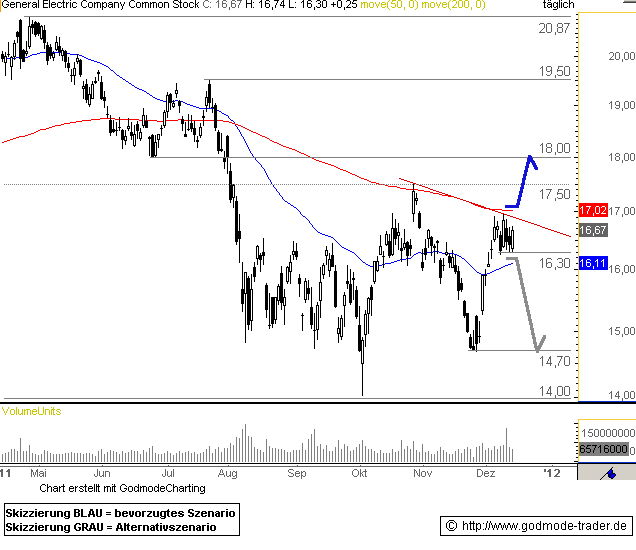 |
S | 18.75 |
02/02/12 | BoGo | |||||
| 12/14/11 | DIA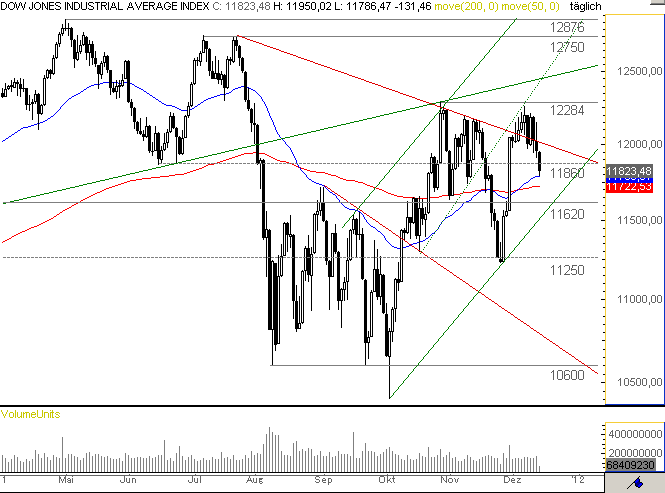 |
S | 126.84 |
02/02/12 | BoGo | |||||
| 12/14/11 | XOM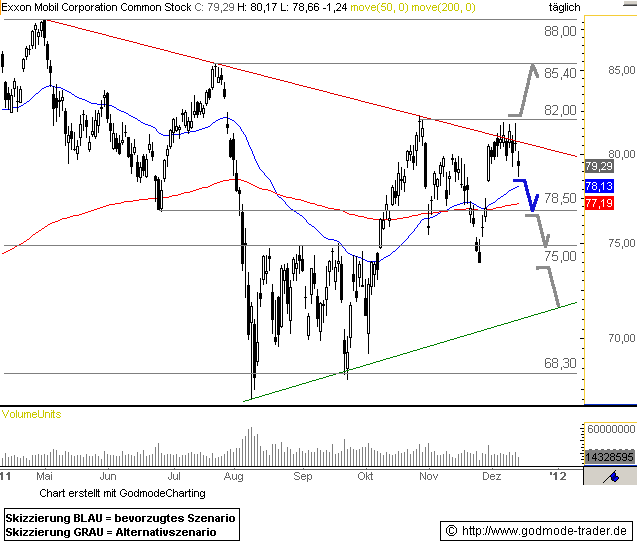 |
S | 83.53 |
02/02/12 | BoGo | |||||
| 12/14/11 | GLD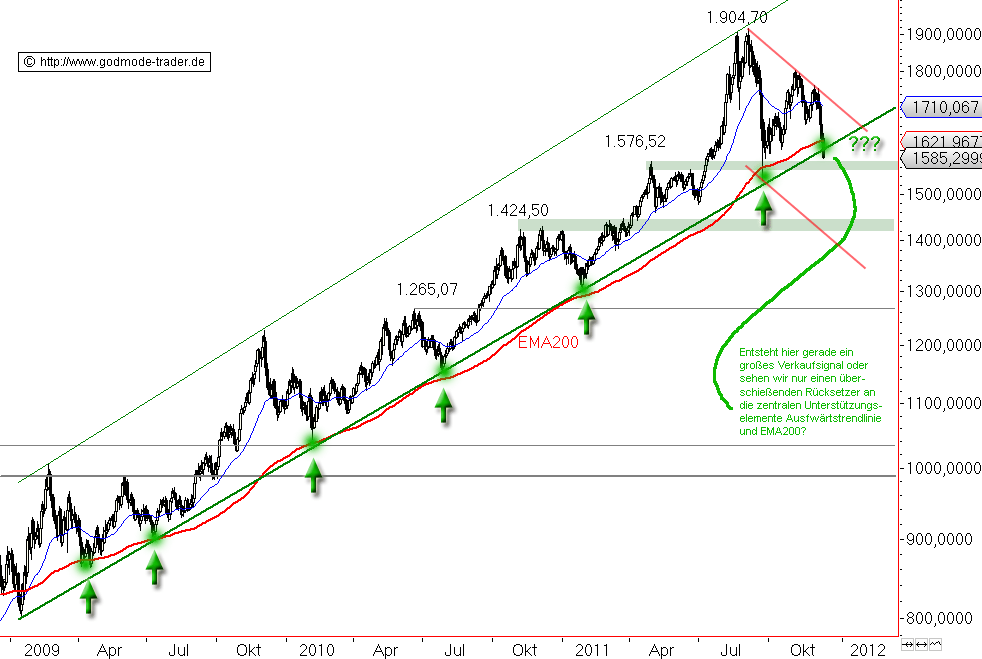 |
S | 171.05 |
02/02/12 | BoGo | |||||
| 12/14/11 | NVDA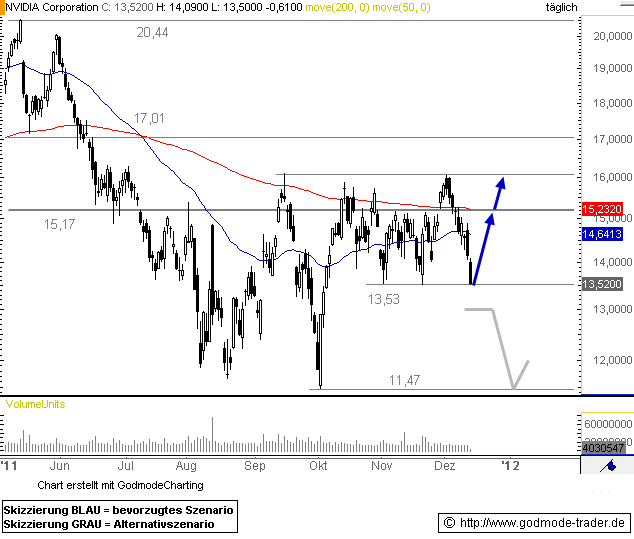 |
S | 15.49 |
02/02/12 | BoGo | |||||
| 12/14/11 | FSLR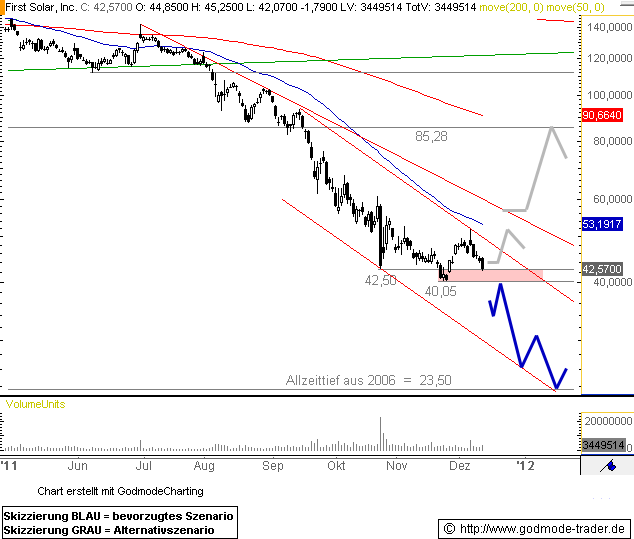 |
S | 44.74 |
02/02/12 | BoGo | |||||
| 12/14/11 | CSCO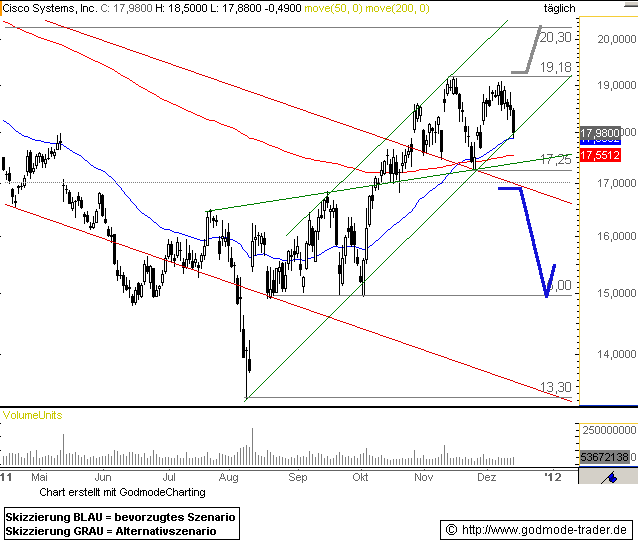 |
S | 19.80 |
02/02/12 | BoGo | |||||
| 12/13/11 | AMZN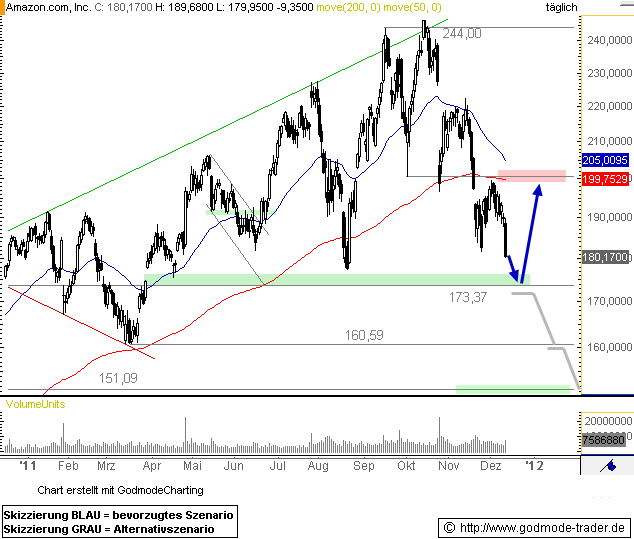 |
S | 181.72 |
02/02/12 | BoGo | |||||
| 12/13/11 | MSFT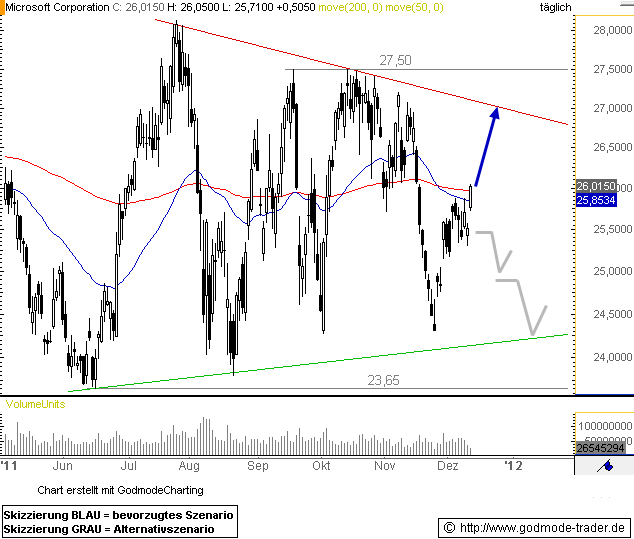 |
S | 29.95 |
02/02/12 | BoGo | |||||
| 12/12/11 | SBUX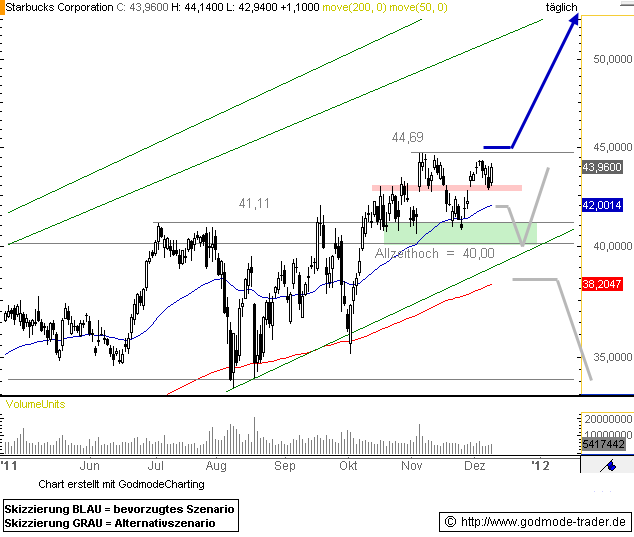 |
S | 47.66 |
02/02/12 | BoGo | |||||
| 12/12/11 | INTC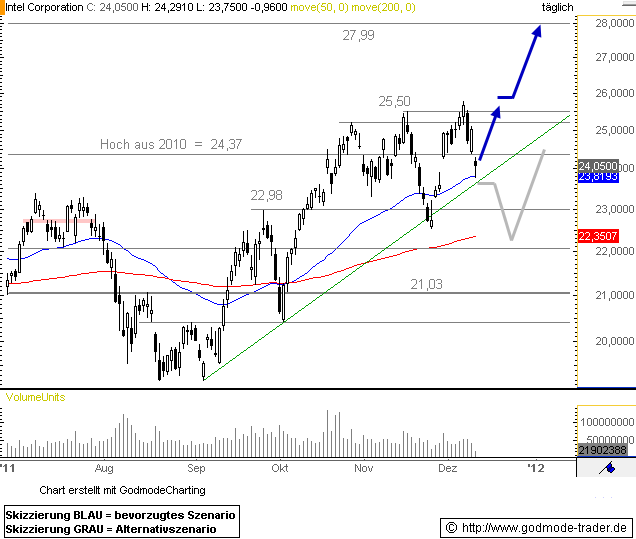 |
S | 26.49 |
02/02/12 | BoGo | |||||
| 12/09/11 | IBM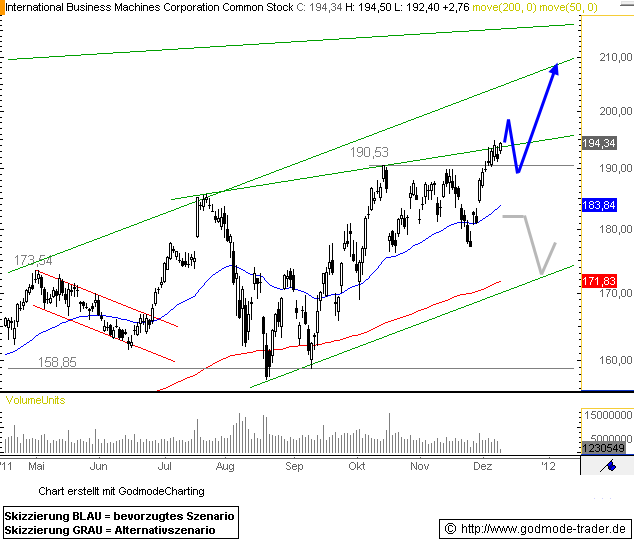 |
S | 191.53 |
02/02/12 | BoGo | |||||
| 12/08/11 | MCD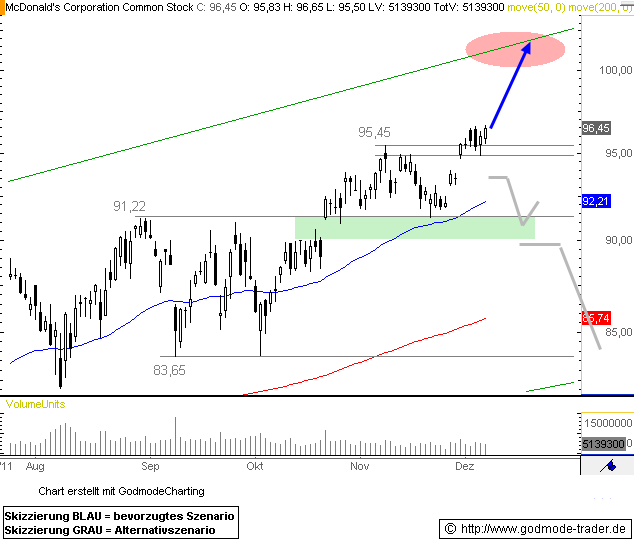 |
S | 98.62 |
02/02/12 | BoGo | |||||
| 12/08/11 | AMZN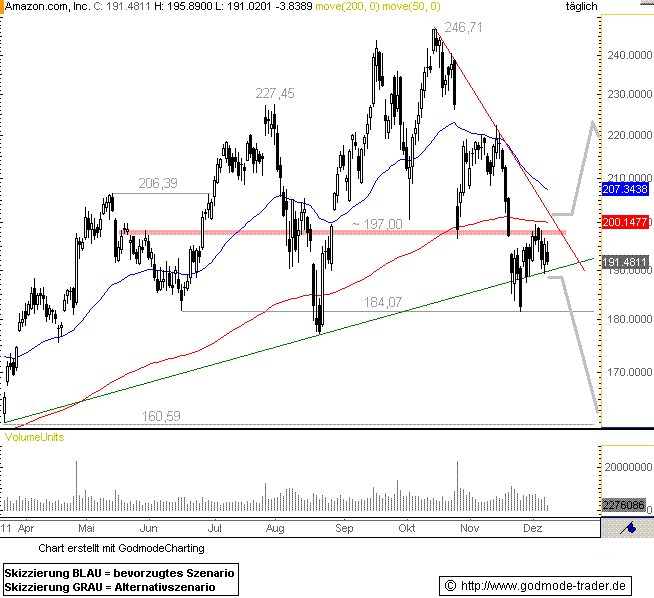 |
S | 181.72 |
02/02/12 | BoGo | |||||
| 12/08/11 | BIDU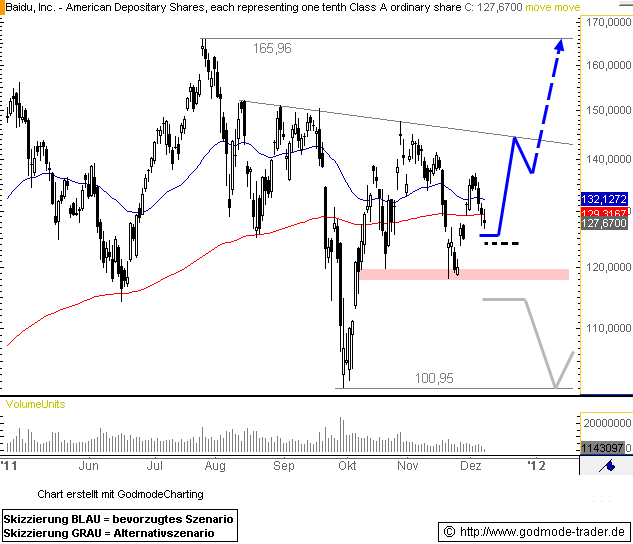 |
S | 130.79 |
02/02/12 | BoGo | |||||
| 12/08/11 | BA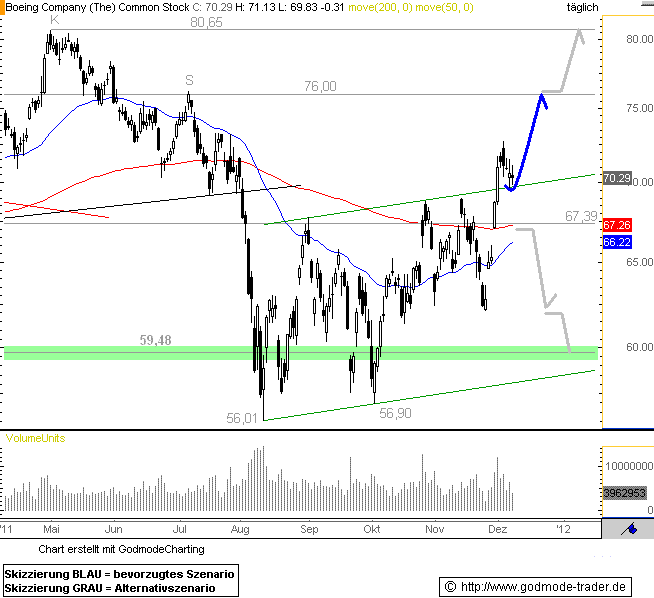 |
S | 75.22 |
02/02/12 | BoGo | |||||
| 12/08/11 | HPQ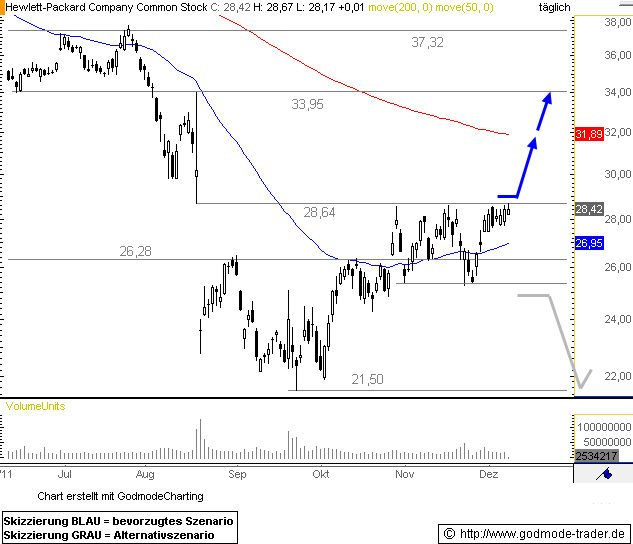 |
S | 28.50 |
02/02/12 | BoGo | |||||
| 12/07/11 | CAT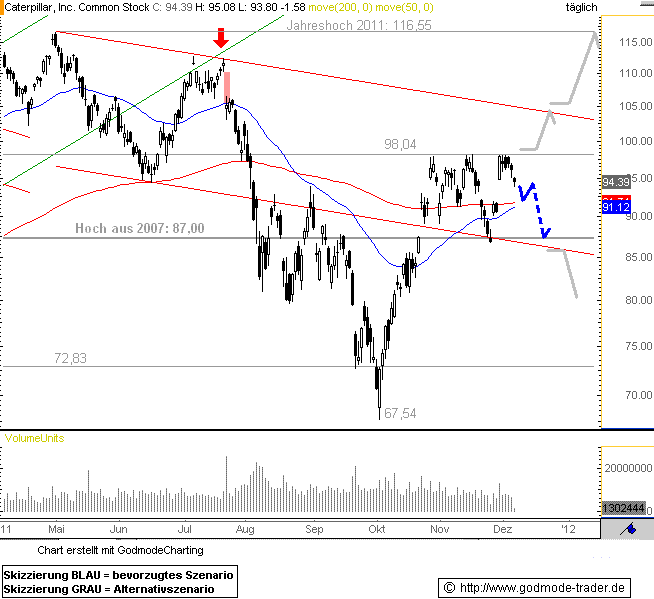 |
S | 110.33 |
02/02/12 | BoGo | |||||
| 12/07/11 | MRK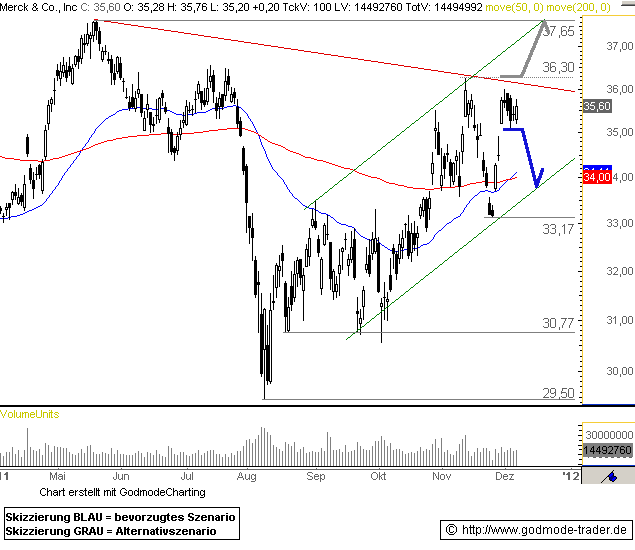 |
S | 38.44 |
02/02/12 | BoGo | |||||
| 12/07/11 | GOOG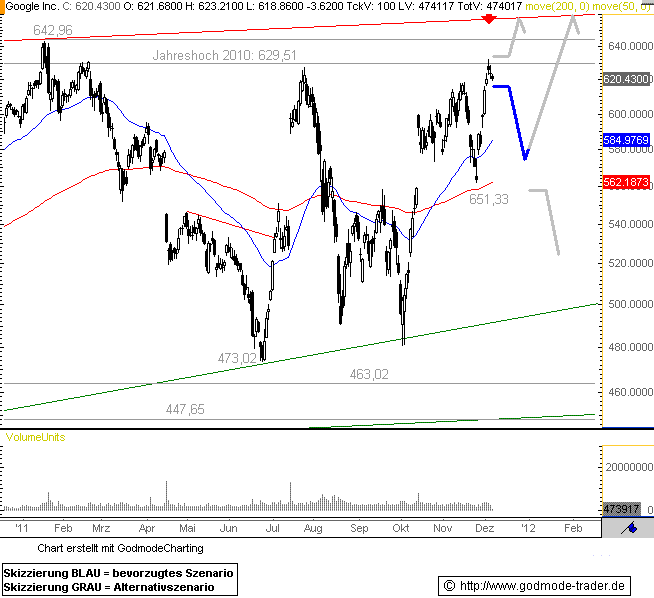 |
S | 585.11 |
02/02/12 | BoGo | |||||
| 12/07/11 | CSCO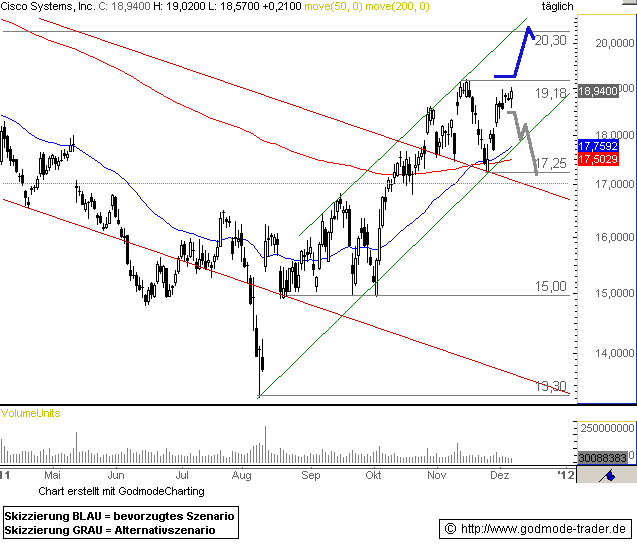 |
S | 19.80 |
02/02/12 | BoGo | |||||
| 12/07/11 | GS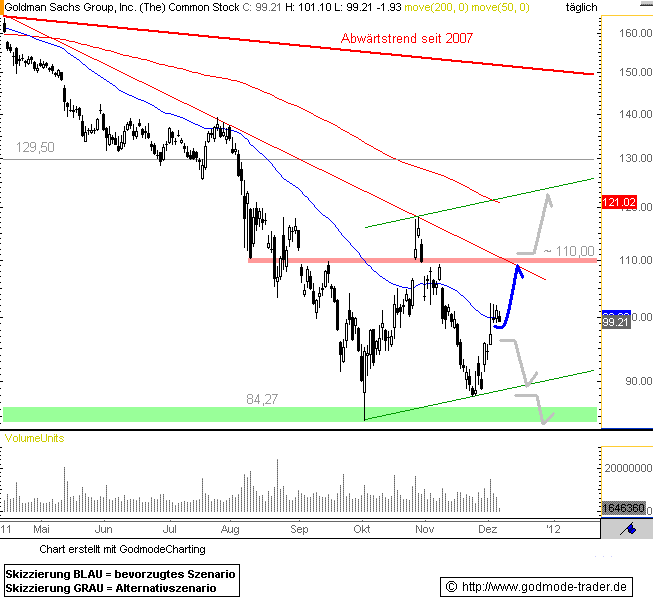 |
S | 113.39 |
02/02/12 | BoGo | |||||
| 12/06/11 | ADP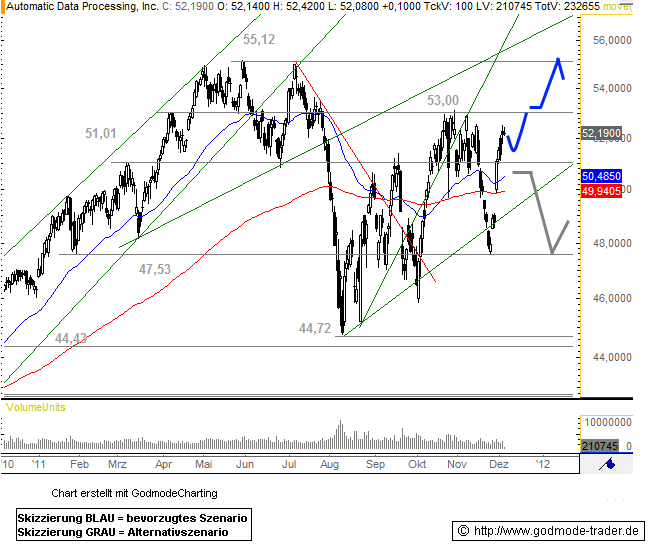 |
S | 54.82 |
02/02/12 | BoGo | |||||
| 12/06/11 | INTC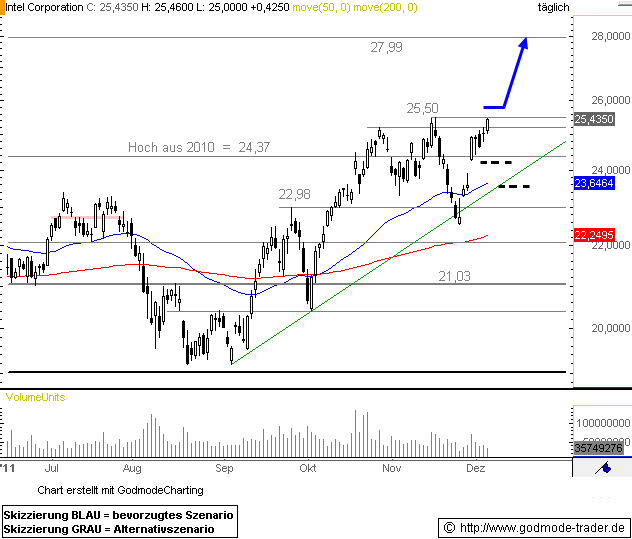 |
S | 26.49 |
02/02/12 | BoGo | |||||
| 12/06/11 | AAPL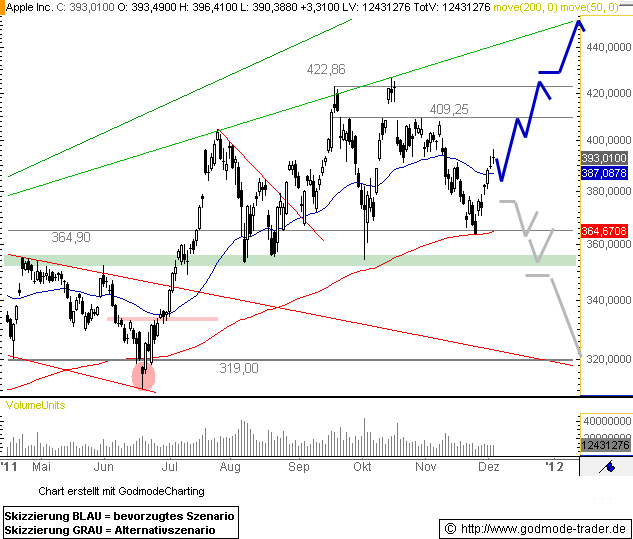 |
S | 455.12 |
02/02/12 | BoGo | |||||
| 12/02/11 | XOM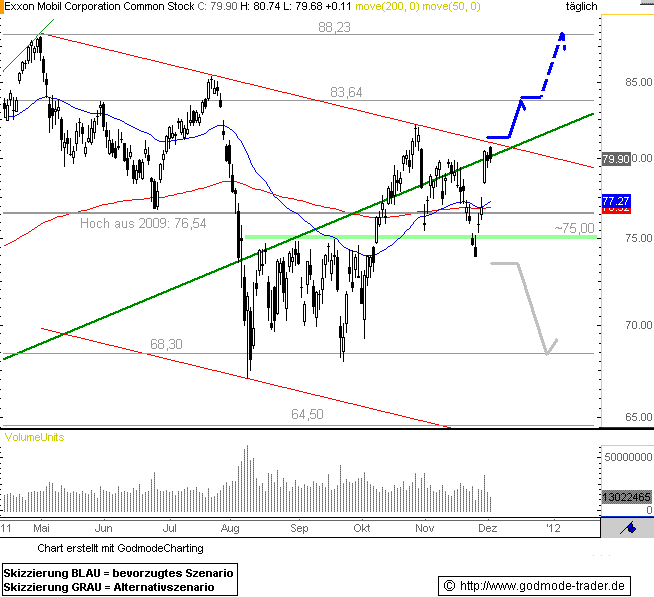 |
S | 83.53 |
02/02/12 | BoGo | |||||
| 11/07/11 | TRV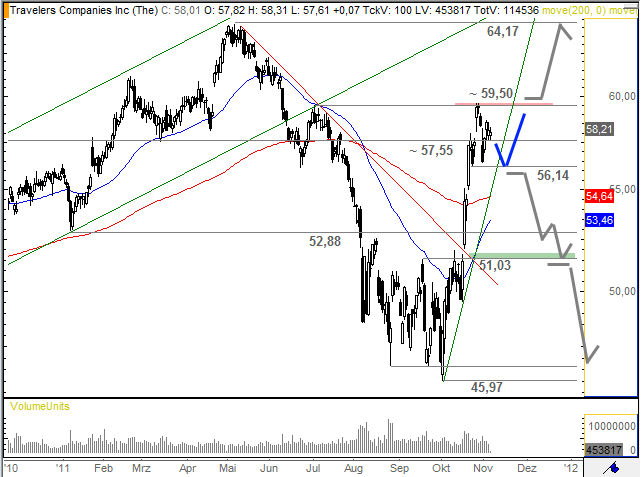 |
L | Stop | 59.50 | 64.17 | 56.14 | 59.39 |
02/02/12 | BoGo | 1.39 |
| 11/07/11 | JPM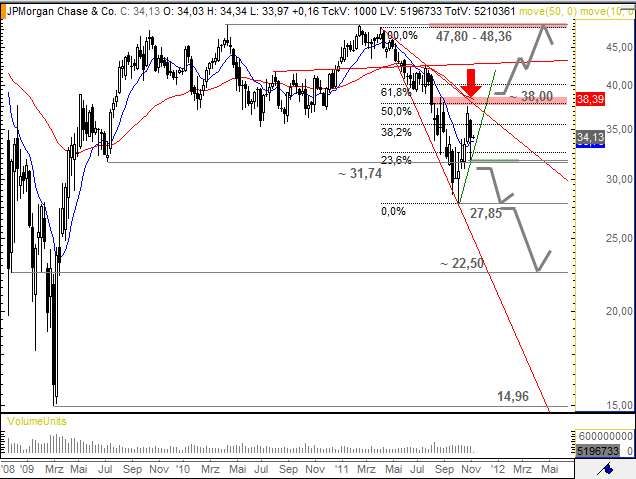 |
S | Stop | 31.74 | 27.85 | 38.00 | 37.55 |
02/02/12 | BoGo | 0.62 |
| 11/04/11 | WMT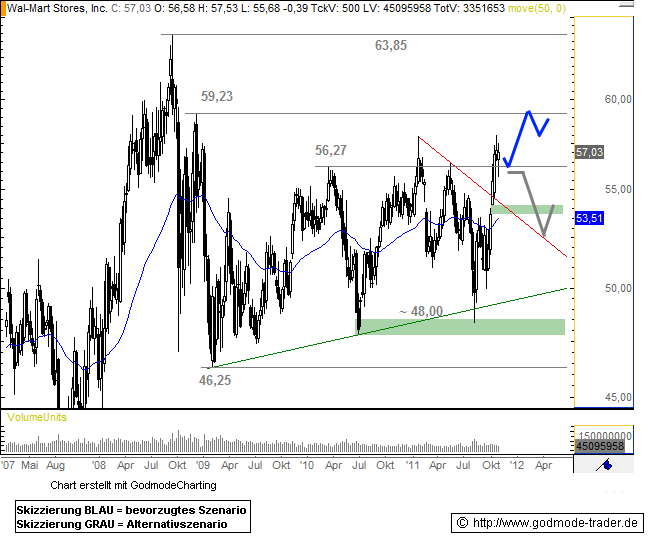 |
L | Limit | 56.27 | 59.23 | 56.00 | 61.94 |
02/02/12 | BoGo | 10.96 |
| 11/04/11 | VZ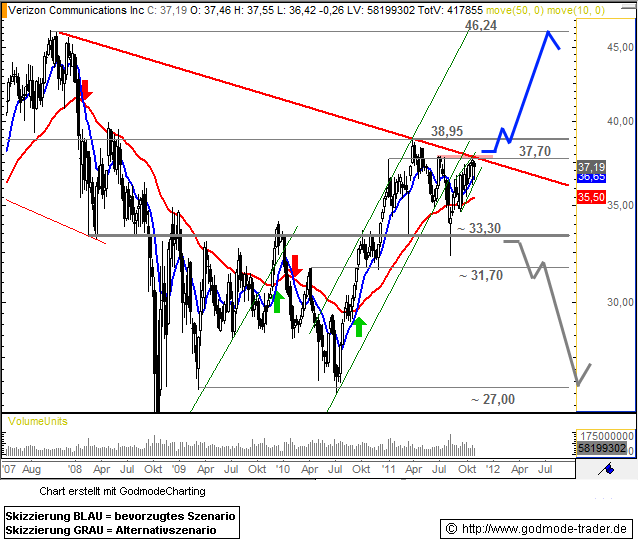 |
L | Stop | 37.70 | 46.24 | 33.30 | 37.56 |
02/02/12 | BoGo | 1.94 |
| 11/02/11 | F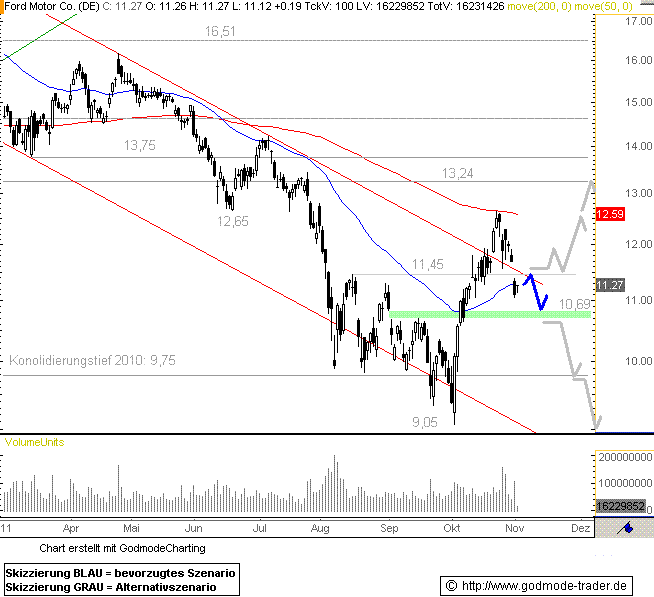 |
L | Stop | 11.45 | 13.24 | 10.69 | 12.26 |
02/02/12 | BoGo | 2.36 |
| 11/02/11 | INTC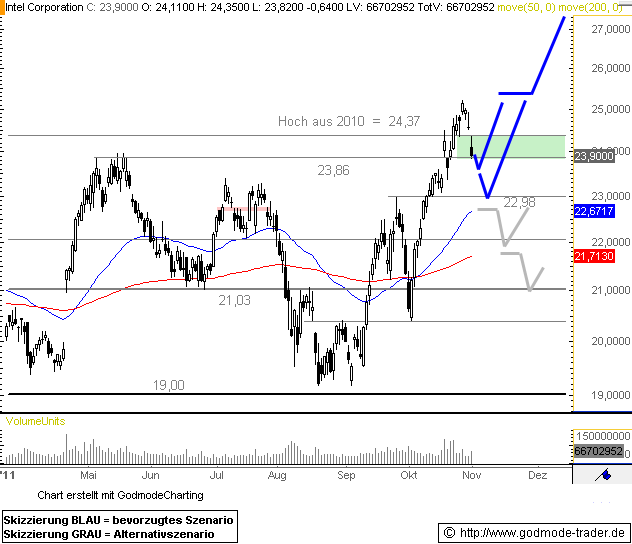 |
L | Limit | 22.98 | 28.00 | 22.65 | 26.49 |
02/02/12 | BoGo | 15.21 |
| 11/02/11 | MCD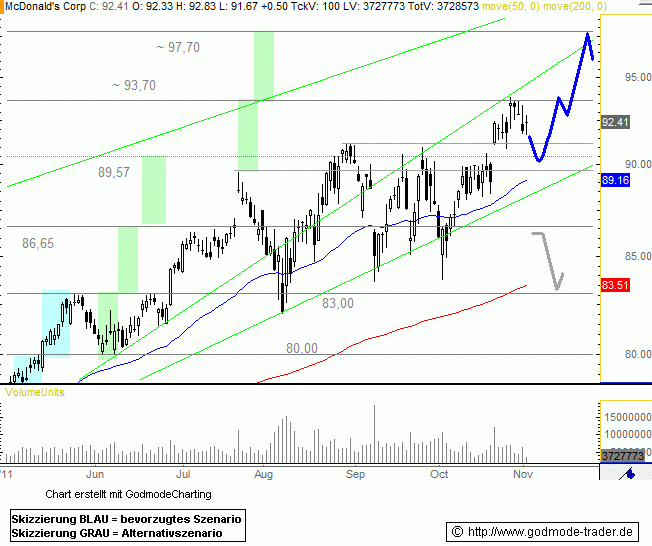 |
L | Limit | 91.22 | 97.70 | 86.65 | 98.62 |
02/02/12 | BoGo | 1.42 |
| 11/02/11 | CSCO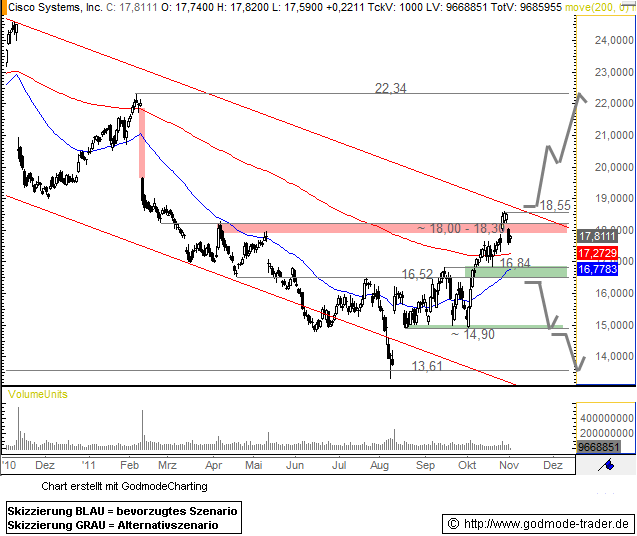 |
L | Stop | 18.55 | 22.34 | 16.52 | 19.80 |
02/02/12 | BoGo | 1.87 |
Last update: 4/12/2012 6:40:38 PM
To the Top Of Best Online Stock Trading Center
Do you find this content useful? Like! Tweet! Recommend! Share!
Current Portfolio Positions - Waiting for Exit Triger
In this table you can find those technical signals where entrance criteria were met and we treat these positions as current constituents of portfolio. Long positions have green background, while short positions have light red background; this is the same as in the table of open signals. Next to already described figures you can find current profit/loss, calculated as difference between entrance price and last available price, which is imported in our system from Yahoo Finance API daily, sometimes even intraday.
| Symbol | L/S | Entry Date | Entry | Target | StopLoss | Quote Date | Last Quote | +/- % | Source |
|---|---|---|---|---|---|---|---|---|---|
NFLX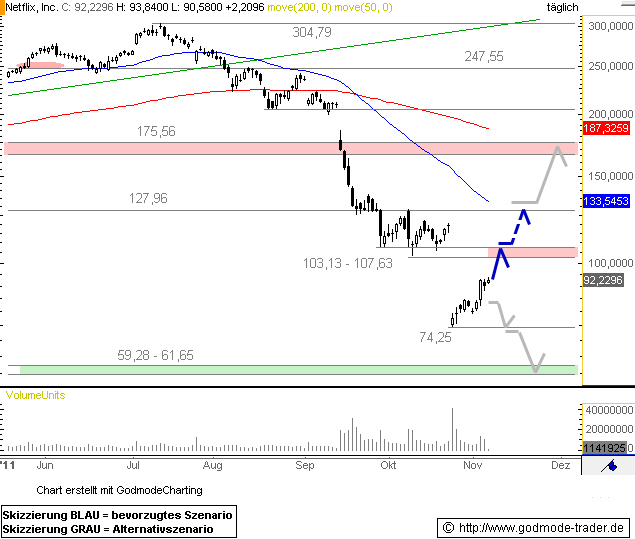 |
L | 11/07/11 | 92.23 | 103.13 | 83.50 | 02/02/12 | 124.00 |
34.45% | BoGo |
ALXN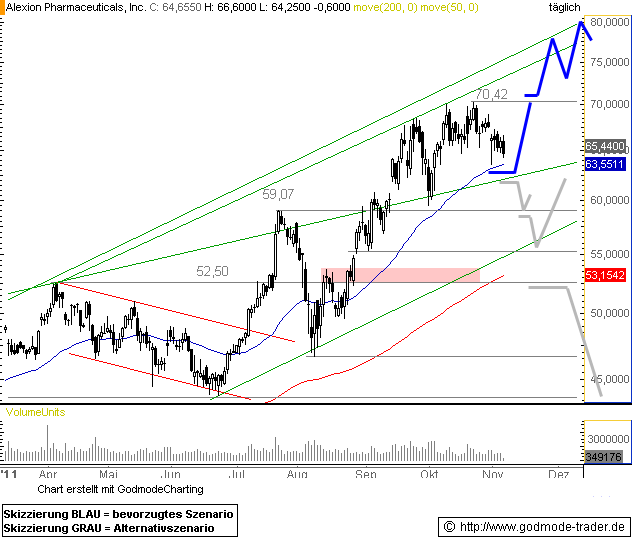 |
L | 11/07/11 | 64.65 | 70.42 | 62.20 | 02/02/12 | 77.78 |
20.31% | BoGo |
CTXS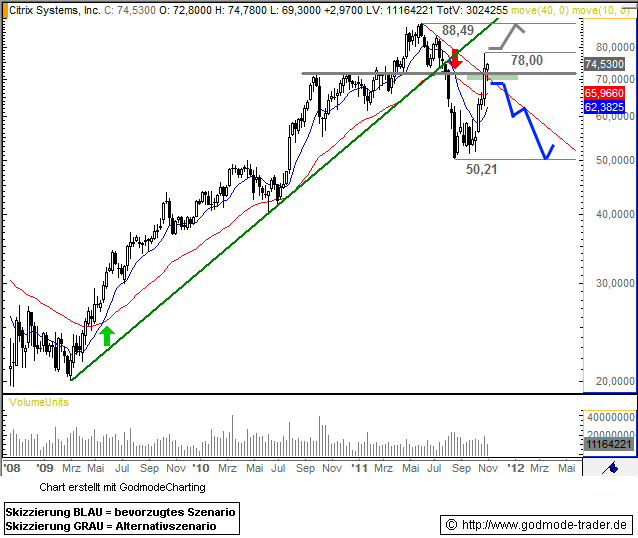 |
S | 11/07/11 | 72.00 | 50.21 | 78.00 | 02/02/12 | 67.28 |
7.02% | BoGo |
GRMN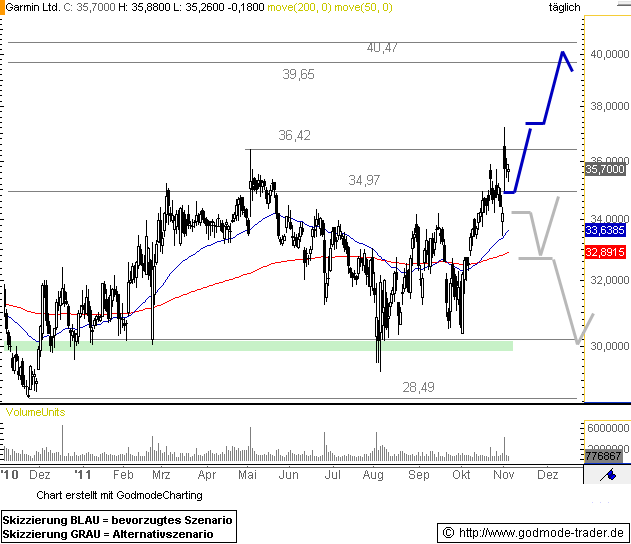 |
L | 11/07/11 | 35.58 | 39.65 | 34.15 | 02/02/12 | 43.53 |
22.34% | BoGo |
SBUX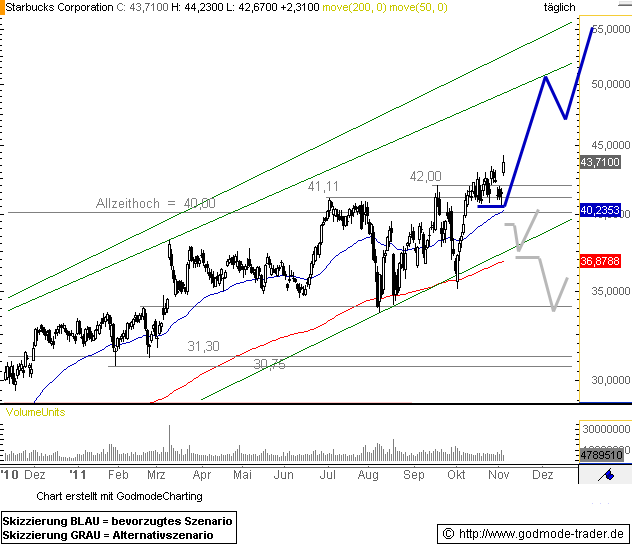 |
L | 11/04/11 | 42.85 | 56.00 | 39.00 | 02/02/12 | 47.66 |
11.23% | BoGo |
WCRX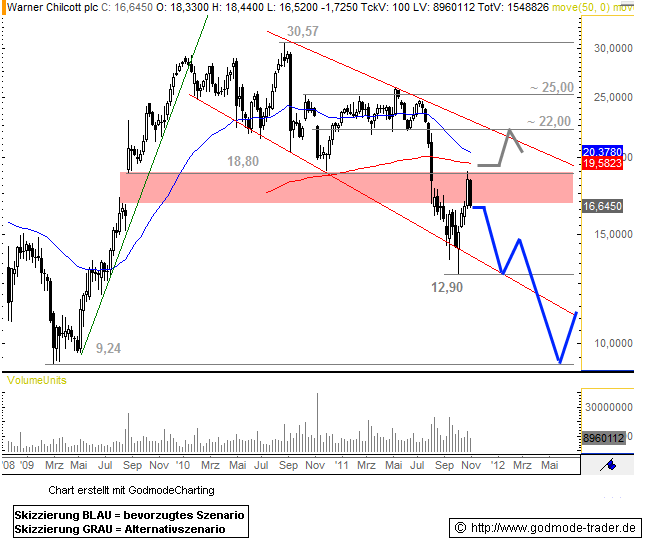 |
S | 11/04/11 | 16.45 | 10.00 | 18.80 | 02/02/12 | 16.45 |
0.00% | BoGo |
MON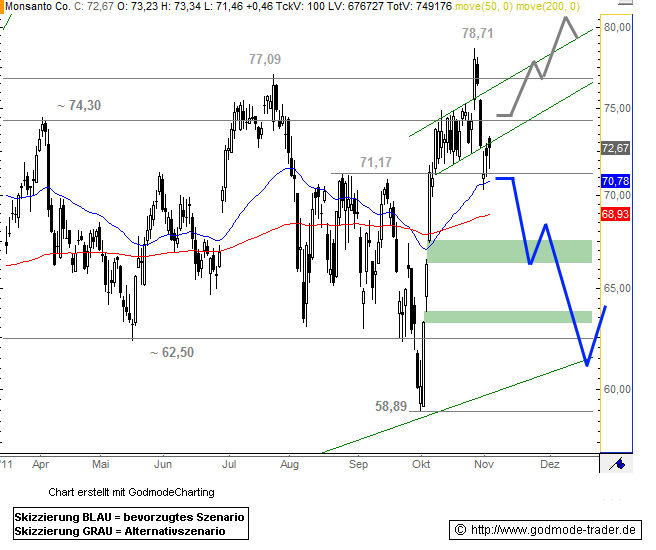 |
S | 11/04/11 | 71.17 | 59.15 | 74.30 | 02/02/12 | 82.13 |
-13.34% | BoGo |
QCOM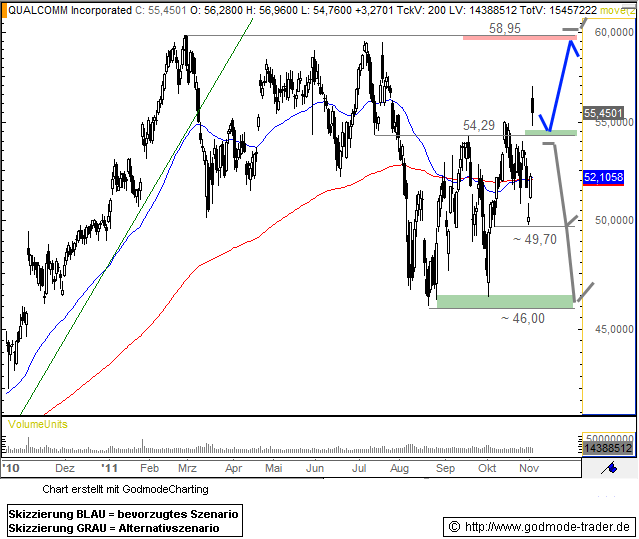 |
L | 11/03/11 | 55.45 | 58.95 | 54.29 | 02/02/12 | 60.73 |
9.52% | BoGo |
AXP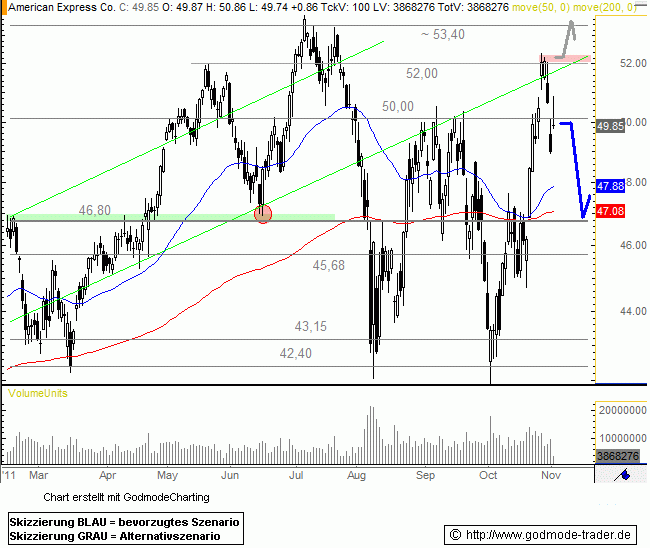 |
S | 11/02/11 | 50.00 | 46.80 | 52.00 | 02/02/12 | 51.16 |
-2.27% | BoGo |
CTSH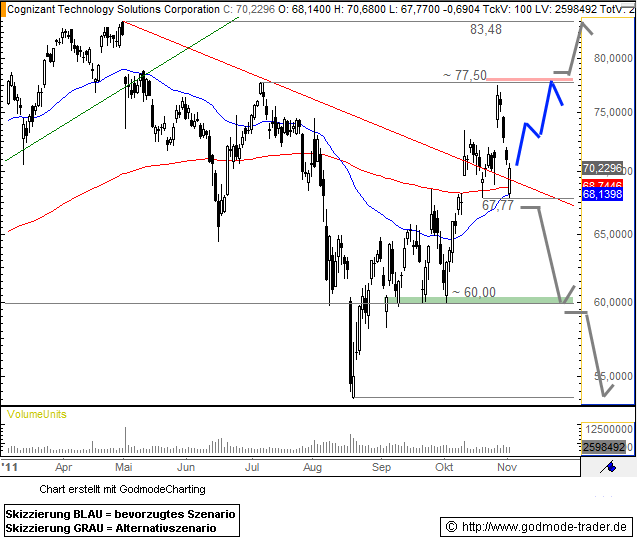 |
L | 11/02/11 | 70.23 | 77.50 | 67.77 | 02/02/12 | 72.62 |
3.40% | BoGo |
BA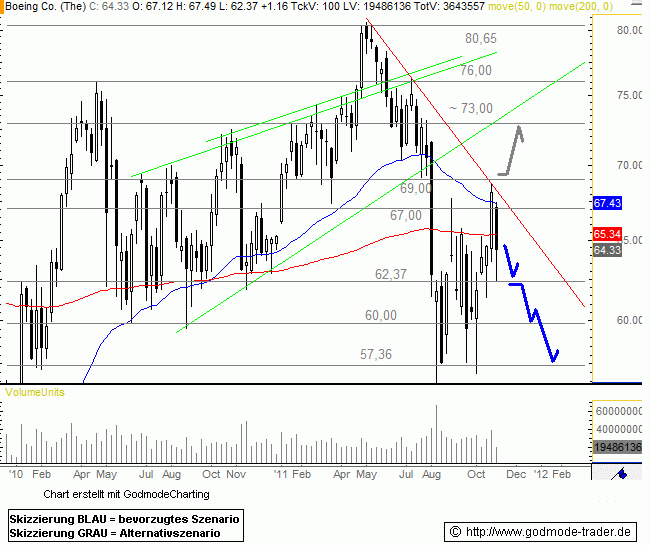 |
S | 11/02/11 | 64.33 | 57.36 | 69.00 | 02/02/12 | 75.22 |
-14.48% | BoGo |
AAPL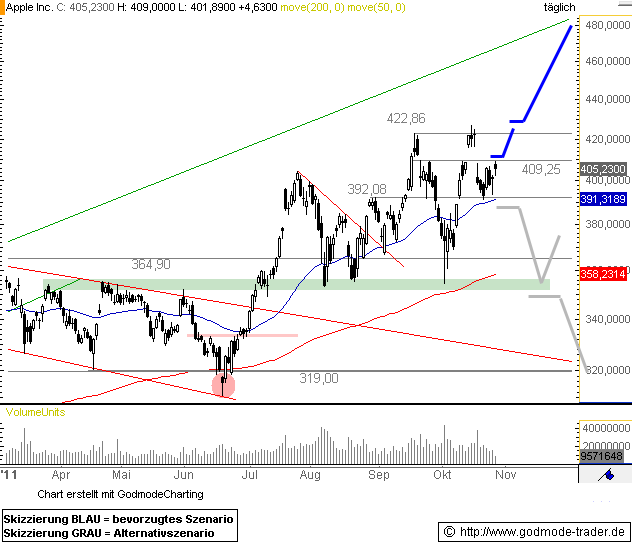 |
L | 10/31/11 | 409.25 | 480.00 | 390.00 | 02/02/12 | 455.12 |
11.21% | BoGo |
XRAY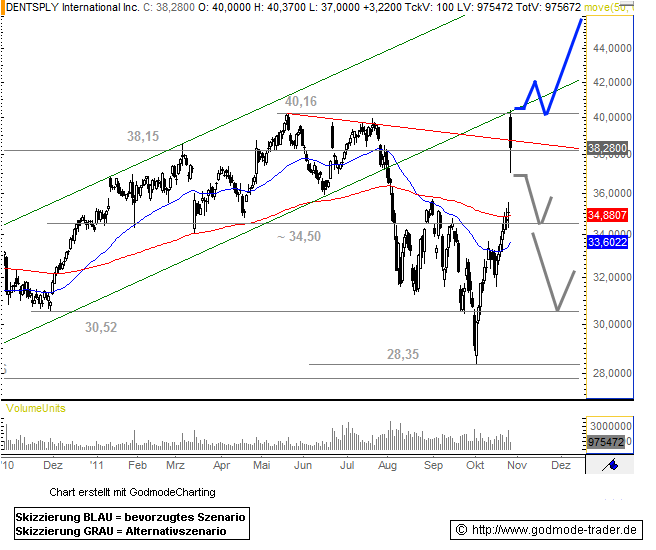 |
L | 10/27/11 | 40.16 | 47.68 | 34.50 | 02/02/12 | 37.95 |
-5.50% | BoGo |
EMC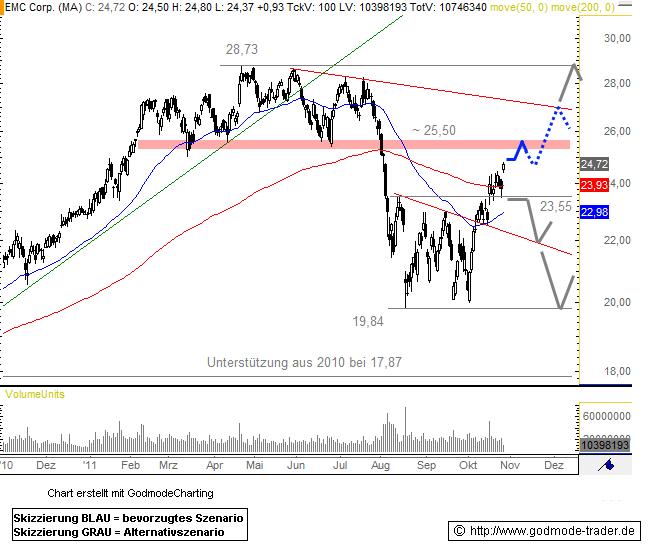 |
L | 10/27/11 | 24.72 | 25.50 | 23.55 | 02/02/12 | 26.01 |
5.22% | BoGo |
AXP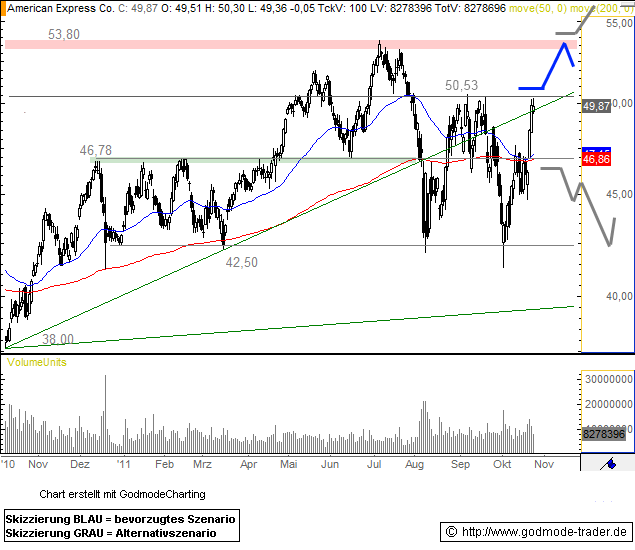 |
L | 10/26/11 | 50.53 | 53.80 | 46.78 | 02/02/12 | 51.16 |
1.25% | BoGo |
PCAR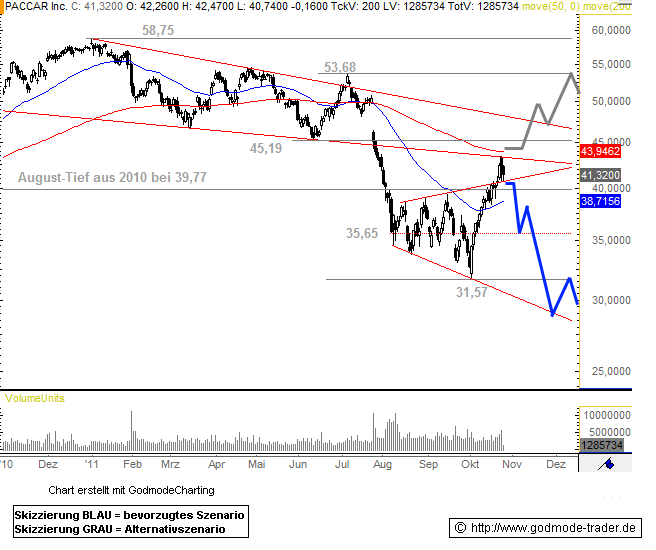 |
S | 10/26/11 | 41.32 | 31.57 | 45.19 | 02/02/12 | 43.24 |
-4.44% | BoGo |
BIIB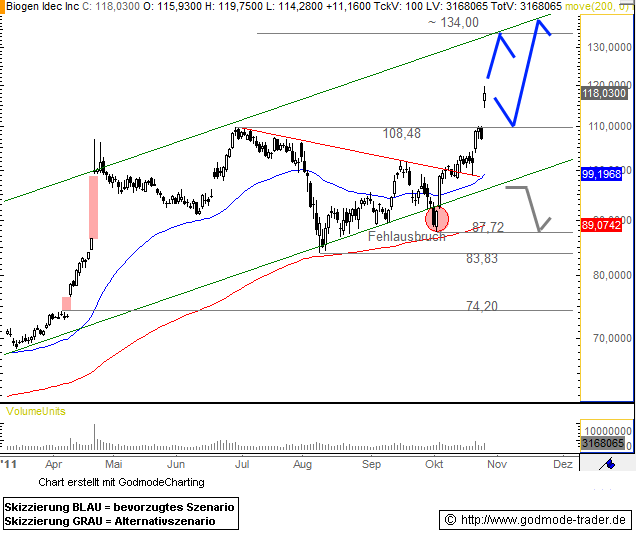 |
L | 10/26/11 | 118.03 | 134.00 | 99.00 | 02/02/12 | 121.26 |
2.74% | BoGo |
S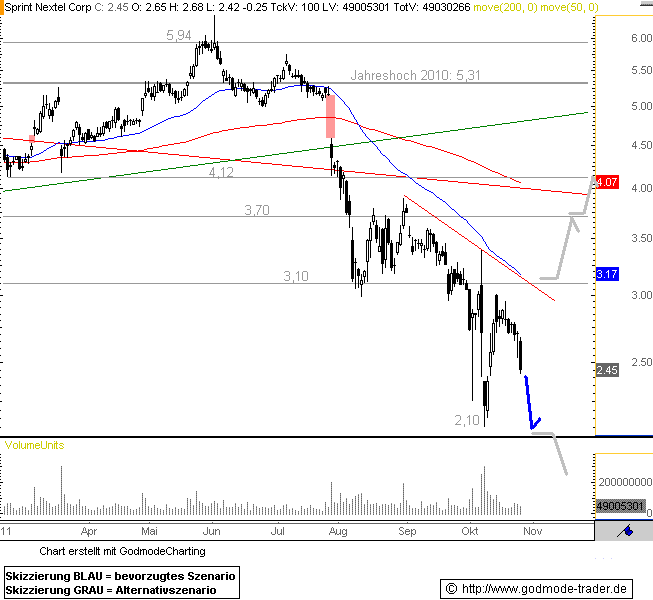 |
S | 10/26/11 | 2.45 | 2.10 | 3.10 | 02/02/12 | 2.21 |
10.86% | BoGo |
ORCL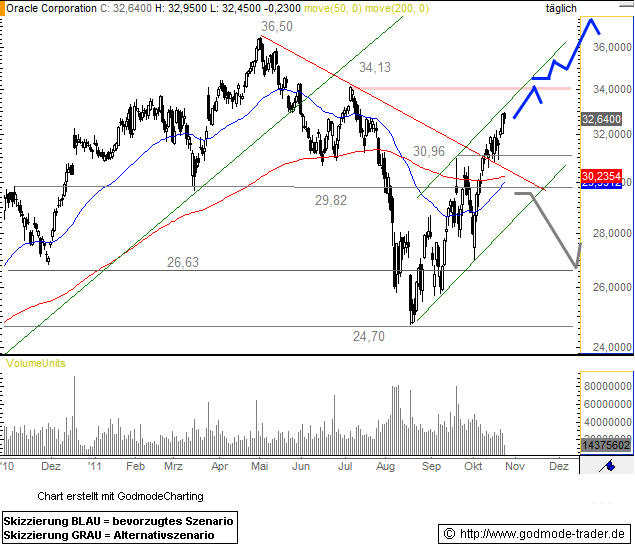 |
L | 10/25/11 | 32.64 | 37.50 | 29.82 | 02/02/12 | 28.81 |
-11.73% | BoGo |
ATVI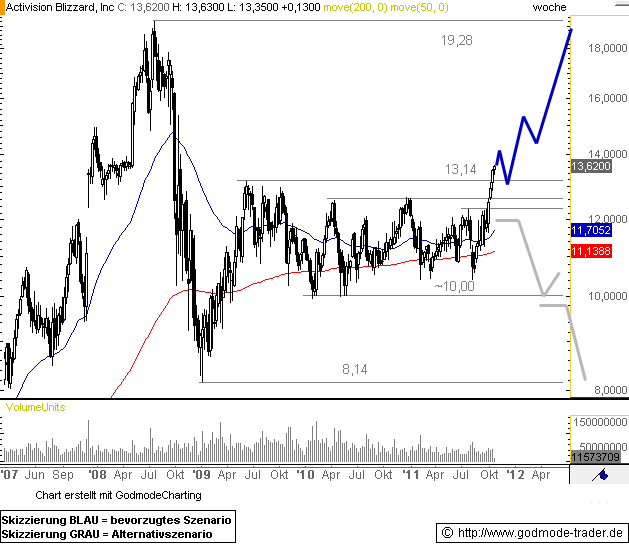 |
L | 10/25/11 | 13.59 | 19.28 | 12.00 | 02/02/12 | 12.18 |
-10.38% | BoGo |
ABT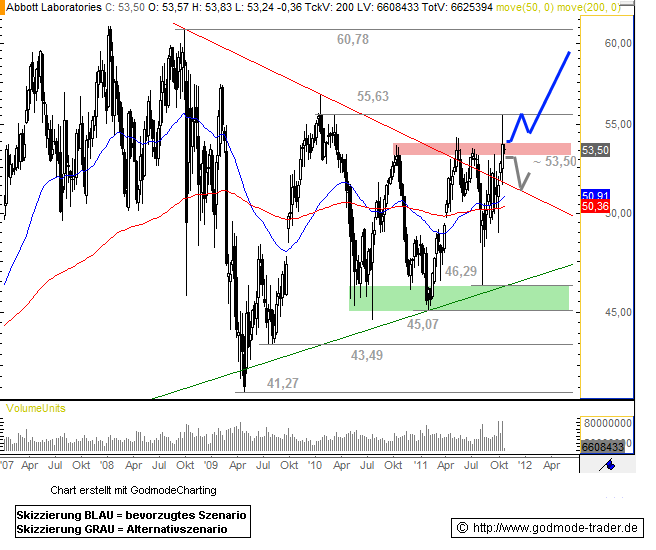 |
L | 10/24/11 | 53.50 | 60.78 | 51.53 | 02/02/12 | 54.45 |
1.78% | BoGo |
MCD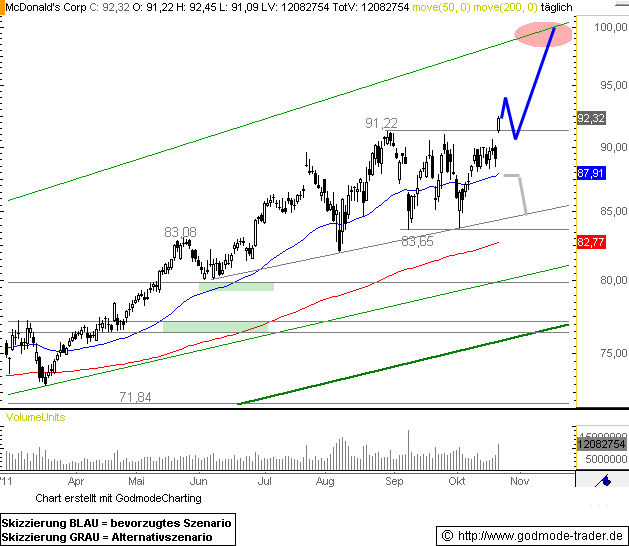 |
L | 10/24/11 | 92.07 | 98.00 | 89.90 | 02/02/12 | 98.62 |
7.11% | BoGo |
MRVL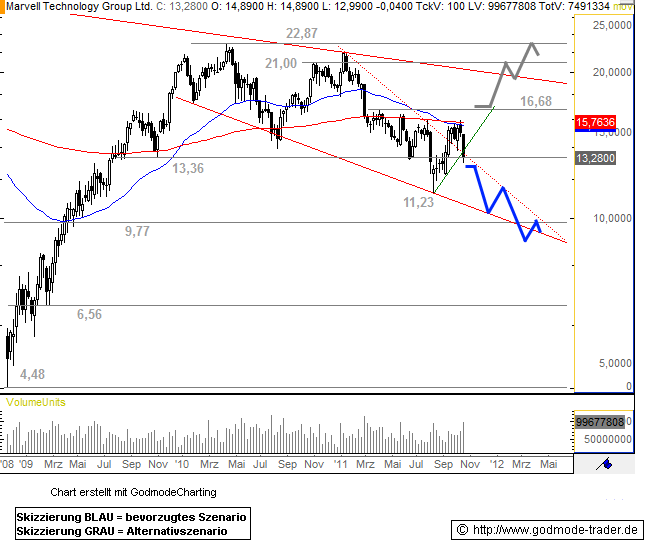 |
S | 10/21/11 | 13.28 | 9.77 | 16.68 | 02/02/12 | 16.51 |
-19.56% | BoGo |
DELL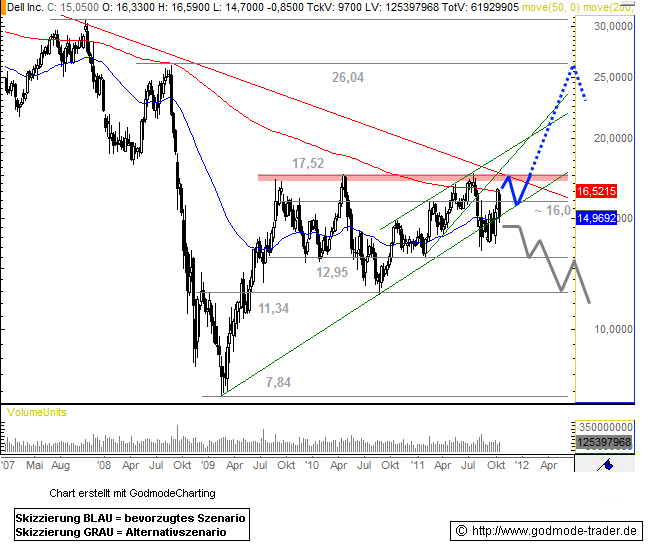 |
L | 10/21/11 | 15.29 | 17.52 | 12.95 | 02/02/12 | 17.60 |
15.11% | BoGo |
LINTA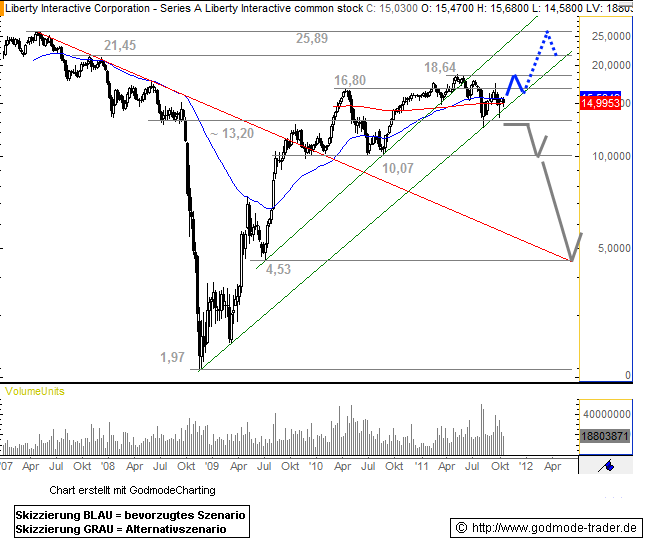 |
L | 10/21/11 | 15.29 | 18.64 | 13.20 | 02/02/12 | 17.50 |
14.45% | BoGo |
LMT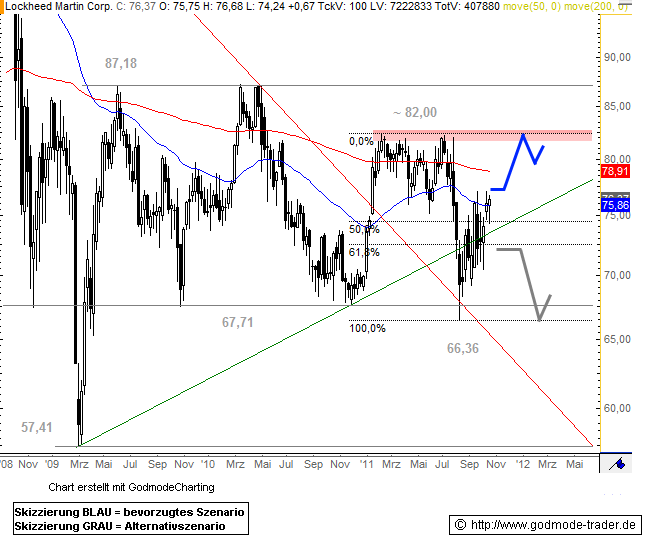 |
L | 10/21/11 | 76.37 | 82.00 | 72.50 | 02/02/12 | 83.17 |
8.90% | BoGo |
DLTR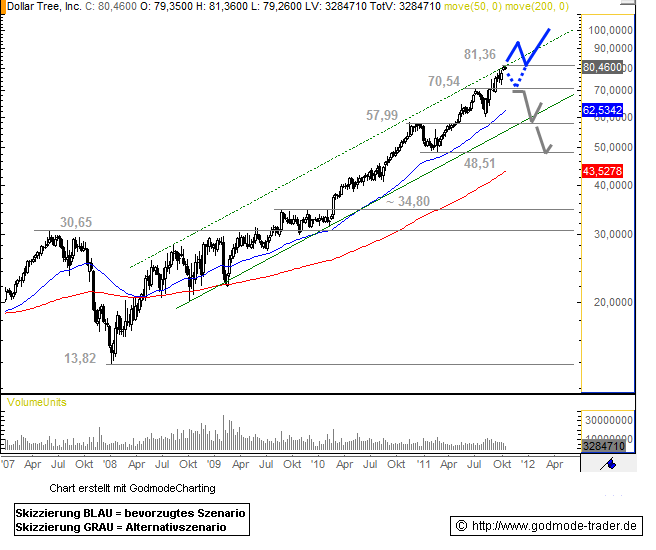 |
L | 10/20/11 | 81.07 | 100.00 | 70.54 | 02/02/12 | 86.03 |
6.12% | BoGo |
CSCO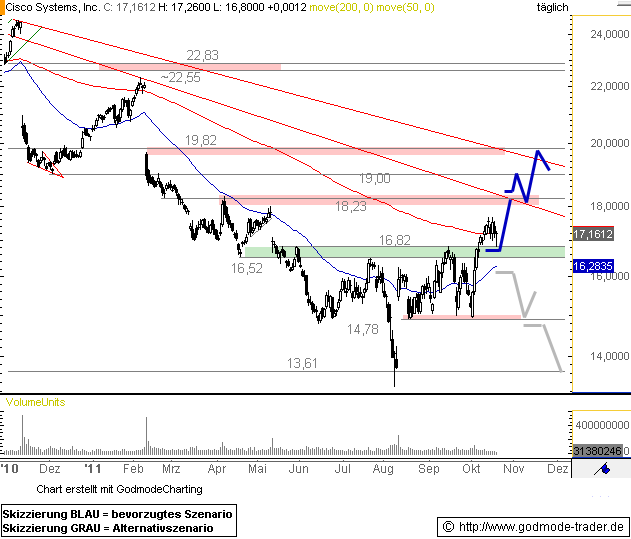 |
L | 10/20/11 | 16.82 | 19.82 | 16.20 | 02/02/12 | 19.80 |
17.72% | BoGo |
SBUX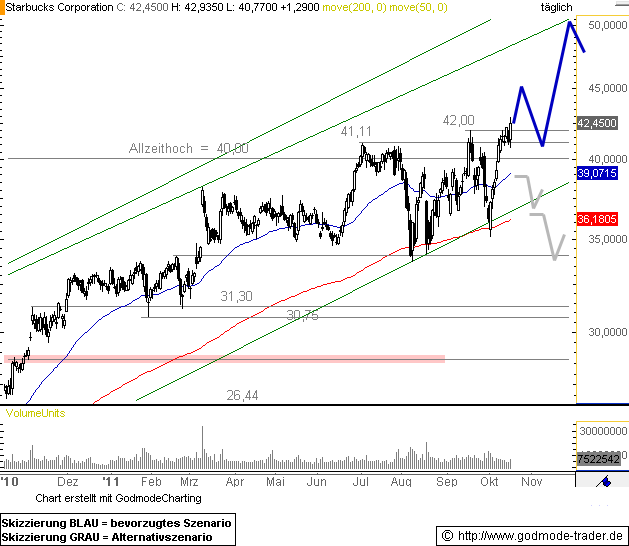 |
L | 10/19/11 | 42.00 | 50.00 | 39.00 | 02/02/12 | 47.66 |
13.48% | BoGo |
INTC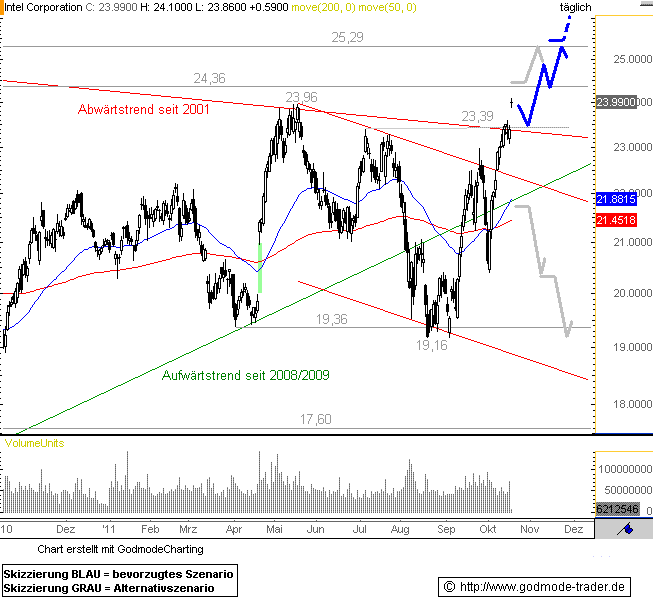 |
L | 10/19/11 | 23.99 | 25.29 | 21.88 | 02/02/12 | 26.49 |
10.42% | BoGo |
Last update: 4/12/2012 6:40:38 PM
To the Top Of Best Online Stock Trading Center
Do you find this content useful? Like! Tweet! Recommend! Share!
Closed Positions and Results
In the third, last table, you can find closed positions. Position is closed either because of target price was met, or stop-loss exit was triggered. We mark positions with positive return with green background, while negative earnings are marked with light red. The table provides you exact date of entry, entry price, and exit date and exit price. Profit or loss is calculated in relative terms and duration represents holding period in days. The source column reveals which service provider has provided the trading signal.
| Symbol | L/S | Entry Date | Entry Price | Exit Date | Exit Price | +/- % | Duration | Source |
|---|---|---|---|---|---|---|---|---|
SHLD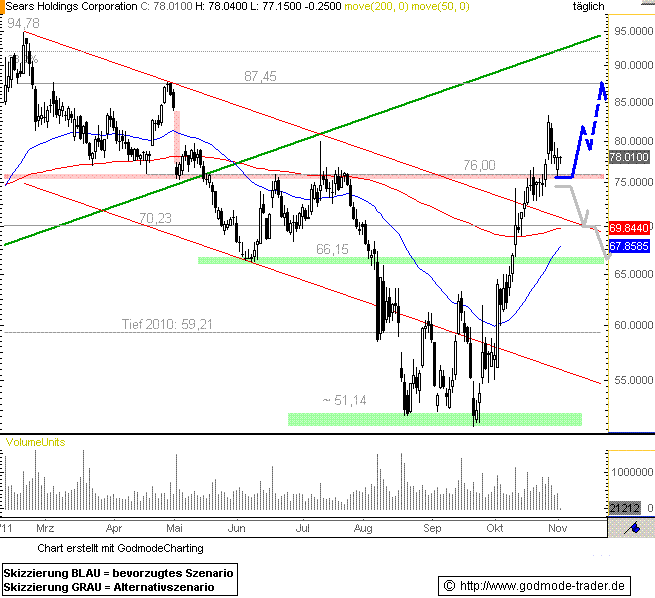 |
L | 11/04/11 | 76.00 | 11/07/11 | 75.50 | -0.66% | 3 | BoGo |
EA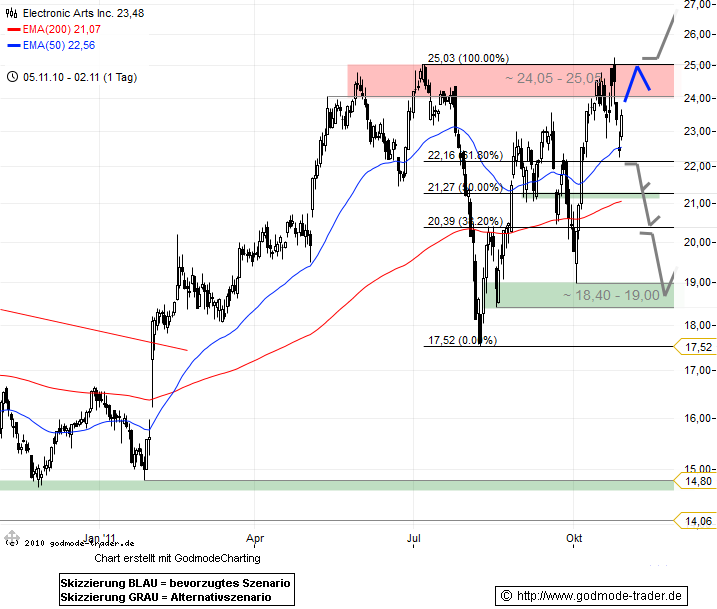 |
L | 11/03/11 | 23.68 | 11/04/11 | 25.00 | 5.57% | 1 | BoGo |
ADSK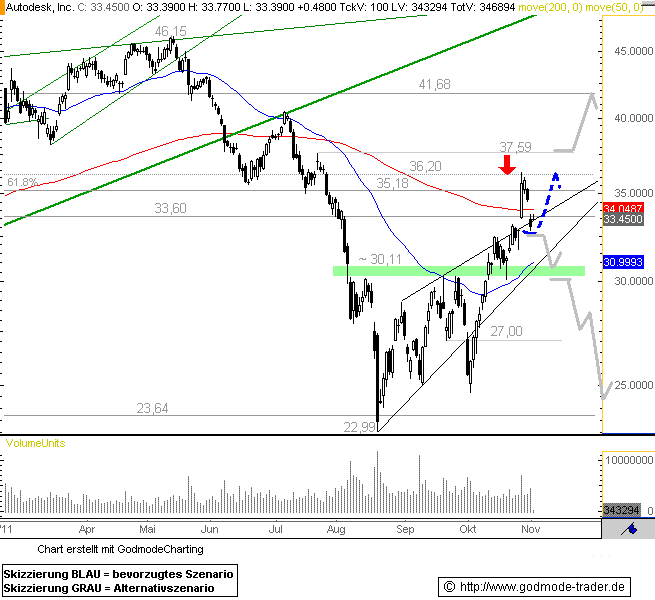 |
L | 11/02/11 | 34.04 | 11/03/11 | 33.60 | -1.29% | 1 | BoGo |
MON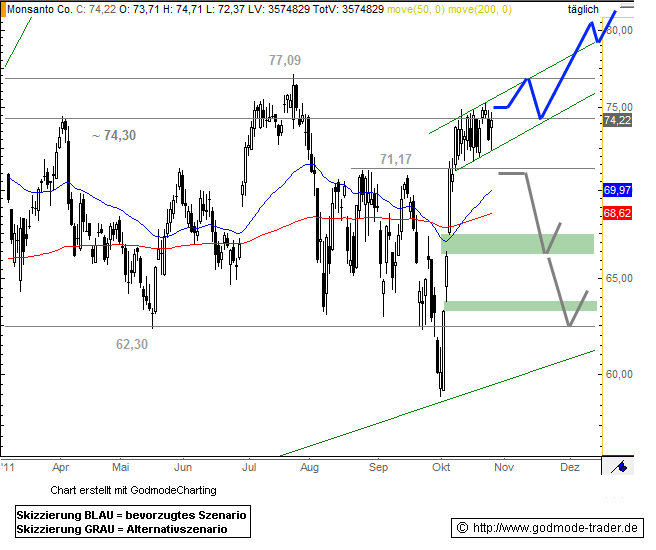 |
L | 10/27/11 | 77.09 | 11/01/11 | 70.92 | -8.00% | 5 | BoGo |
BA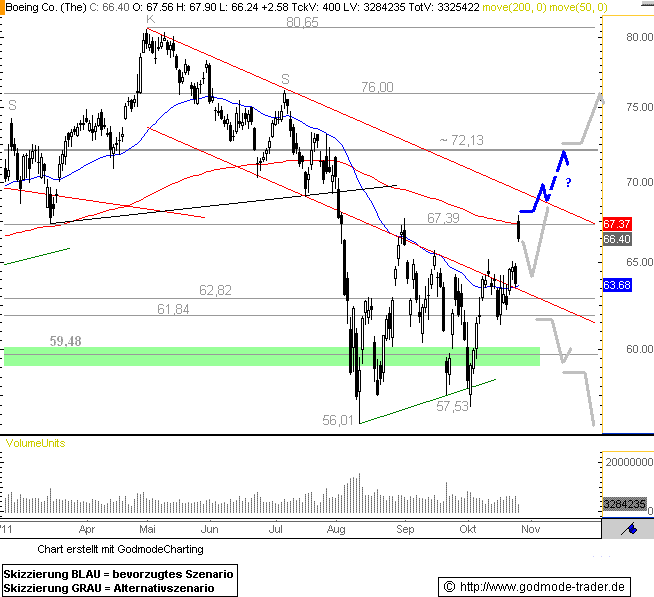 |
L | 10/26/11 | 67.39 | 11/01/11 | 64.23 | -4.69% | 6 | BoGo |
GS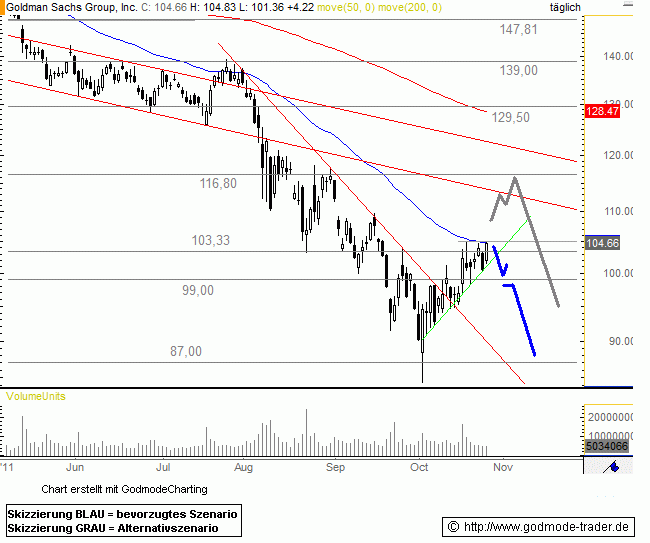 |
S | 10/26/11 | 104.66 | 10/27/11 | 110.33 | -5.14% | 1 | BoGo |
YHOO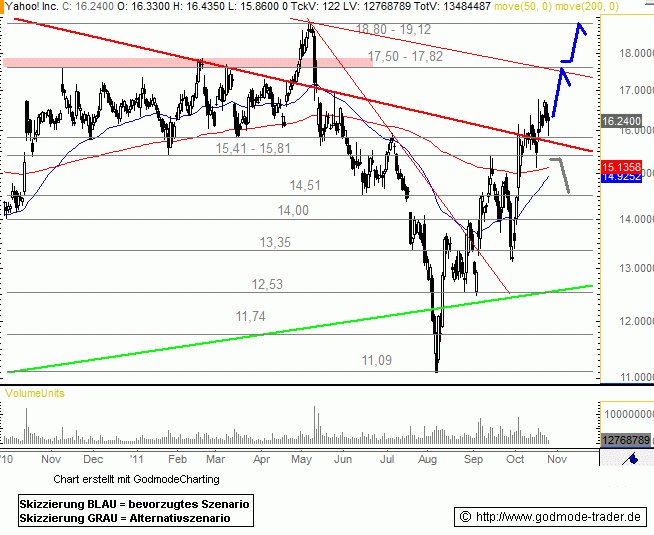 |
L | 10/26/11 | 16.24 | 11/01/11 | 14.95 | -7.94% | 6 | BoGo |
AMZN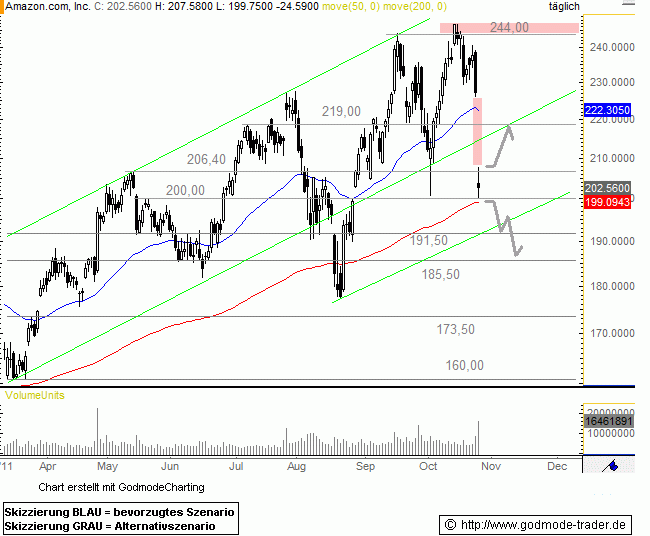 |
S | 10/26/11 | 202.56 | 10/27/11 | 206.40 | -1.86% | 1 | BoGo |
ADP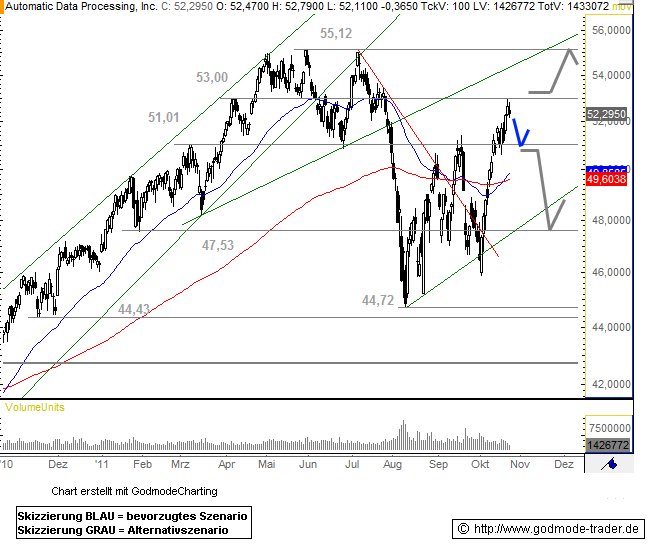 |
S | 10/25/11 | 52.29 | 10/26/11 | 51.00 | 2.53% | 1 | BoGo |
NFLX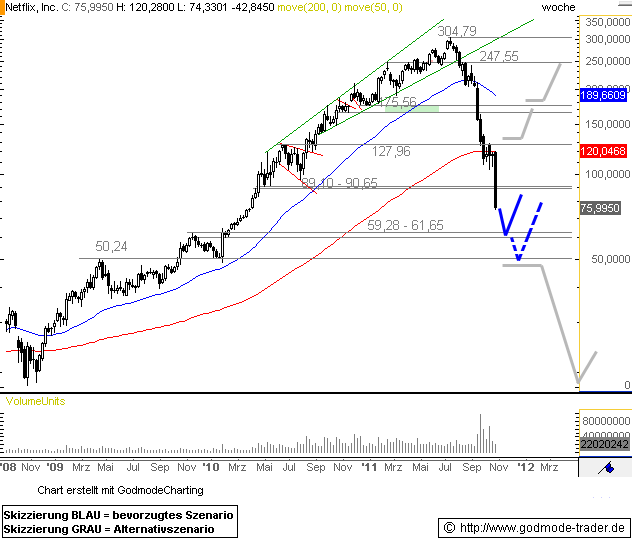 |
S | 10/25/11 | 75.99 | 11/03/11 | 90.65 | -16.17% | 9 | BoGo |
FSLR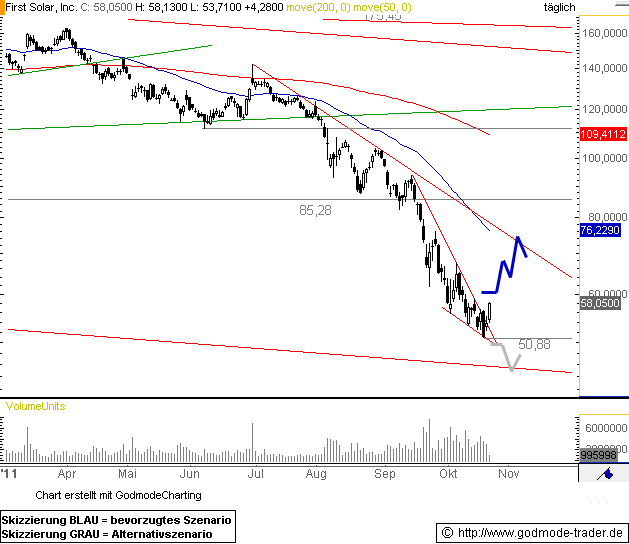 |
L | 10/24/11 | 58.05 | 10/25/11 | 50.00 | -13.87% | 1 | BoGo |
URBN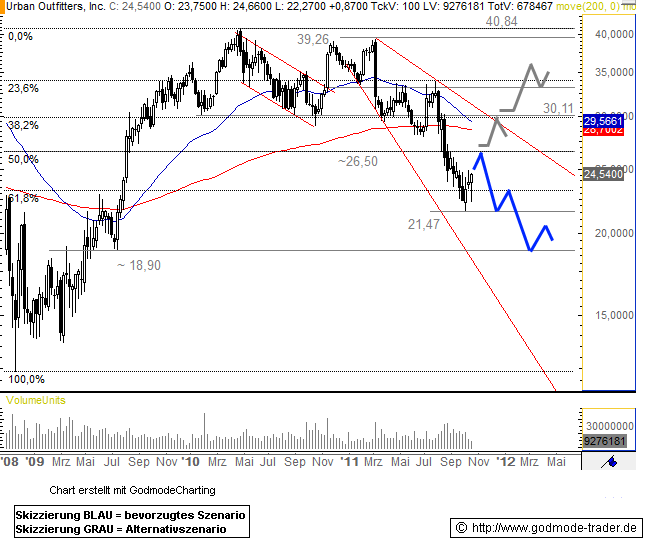 |
S | 10/24/11 | 26.00 | 10/25/11 | 26.50 | -1.89% | 1 | BoGo |
F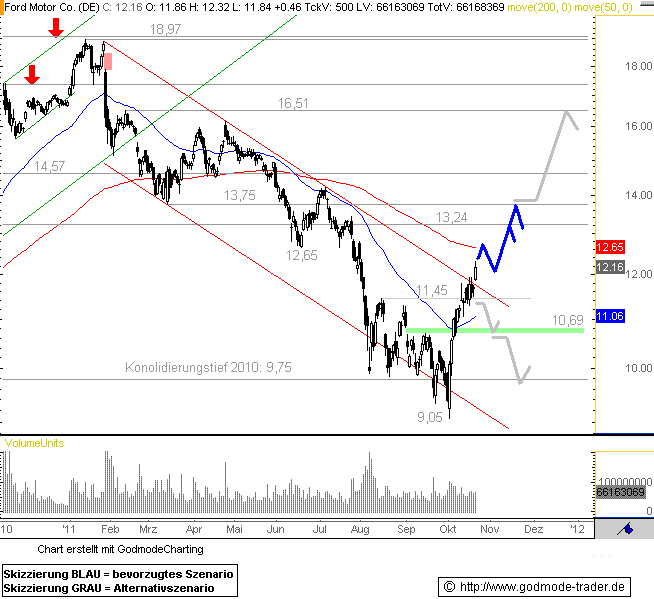 |
L | 10/21/11 | 12.16 | 11/01/11 | 11.33 | -6.83% | 11 | BoGo |
AMZN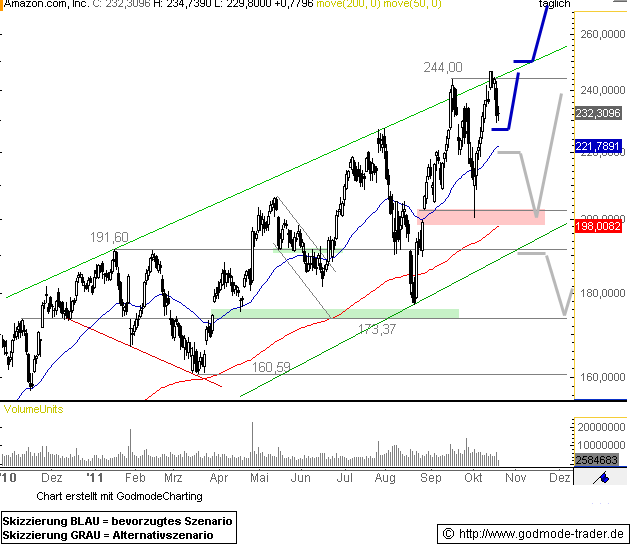 |
L | 10/20/11 | 232.31 | 10/26/11 | 203.89 | -12.23% | 6 | BoGo |
JPM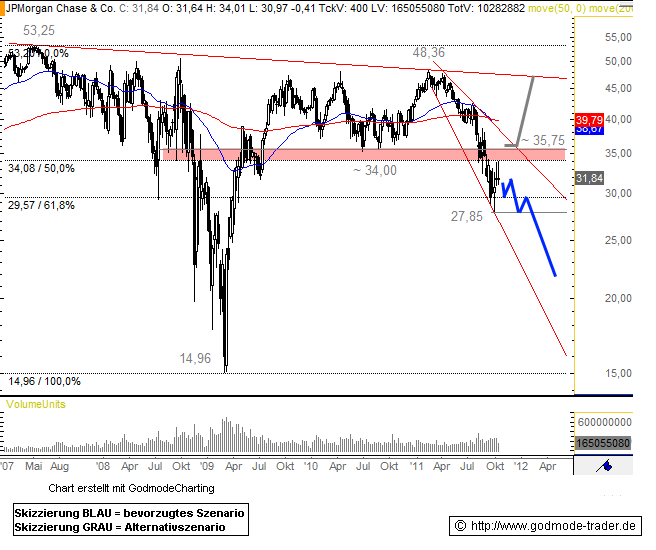 |
S | 10/20/11 | 31.84 | 10/27/11 | 36.56 | -12.91% | 7 | BoGo |
JOYG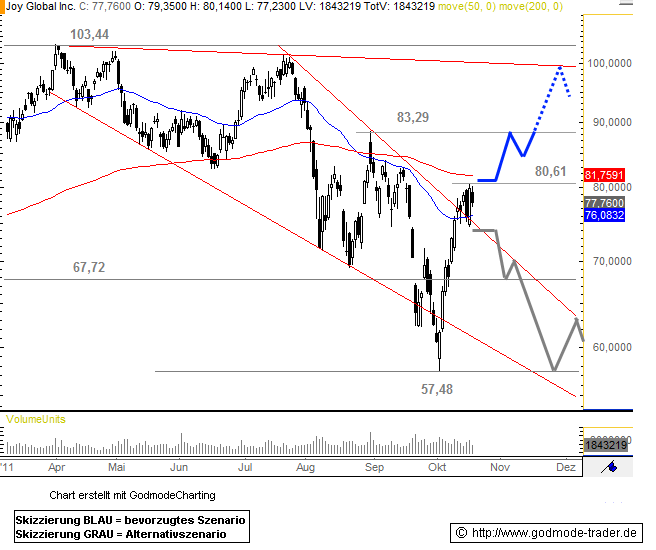 |
L | 10/20/11 | 77.69 | 10/24/11 | 84.23 | 8.42% | 4 | BoGo |
YHOO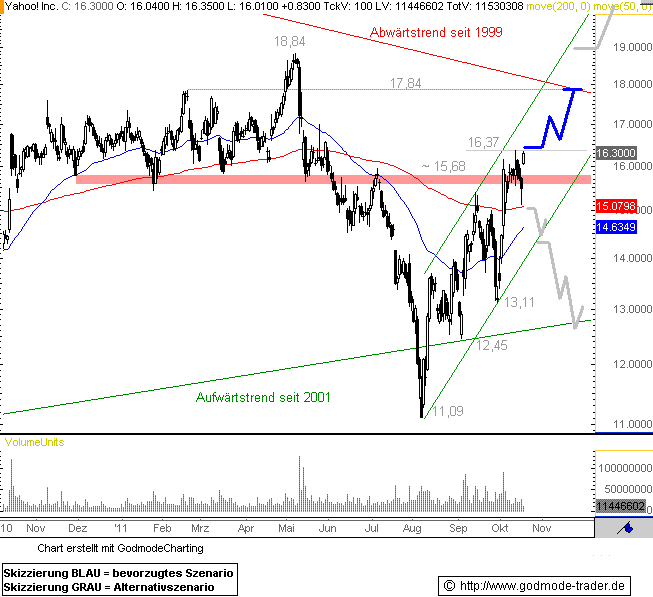 |
L | 10/19/11 | 16.37 | 11/01/11 | 14.95 | -8.67% | 13 | BoGo |
AKAM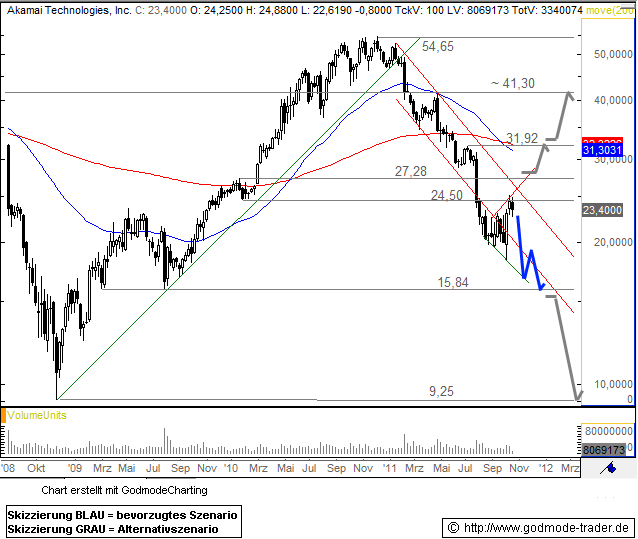 |
S | 10/18/11 | 23.40 | 10/27/11 | 27.35 | -14.44% | 9 | BoGo |
BIIB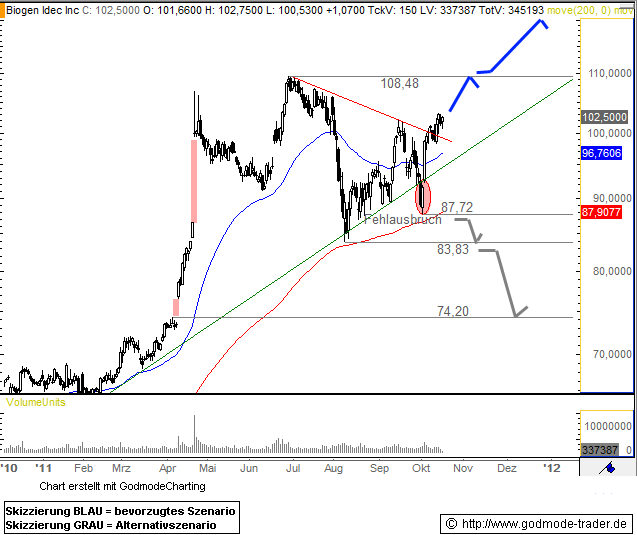 |
L | 10/18/11 | 102.50 | 10/28/11 | 120.00 | 17.07% | 10 | BoGo |
BA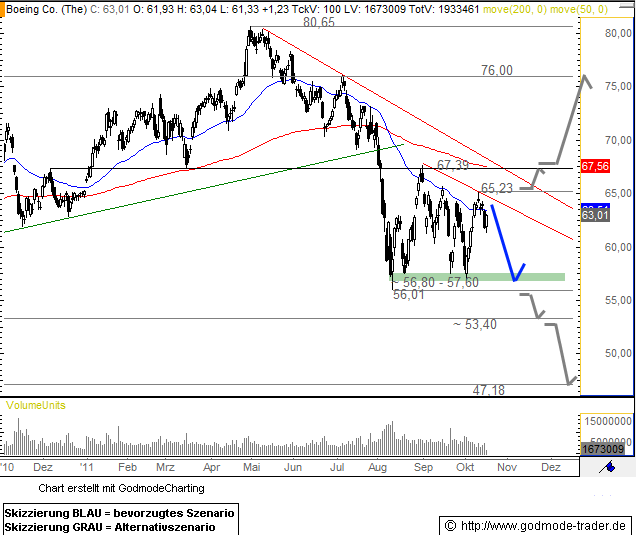 |
S | 10/18/11 | 63.01 | 10/26/11 | 67.56 | -6.73% | 8 | BoGo |
FSLR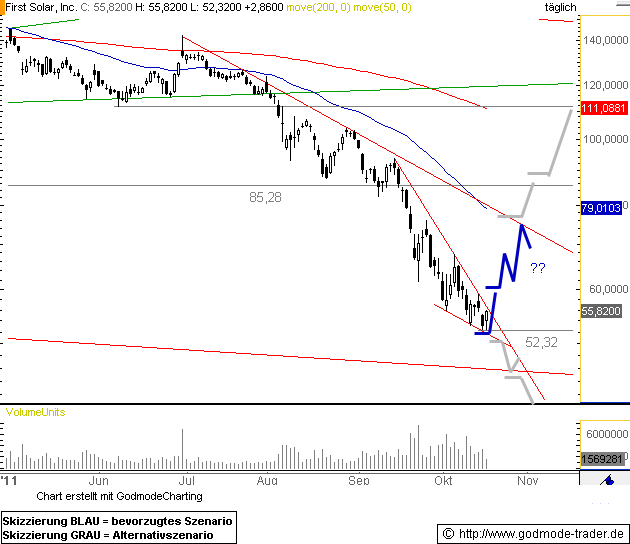 |
L | 10/18/11 | 52.82 | 10/19/11 | 51.00 | -3.45% | 1 | BoGo |
SHLD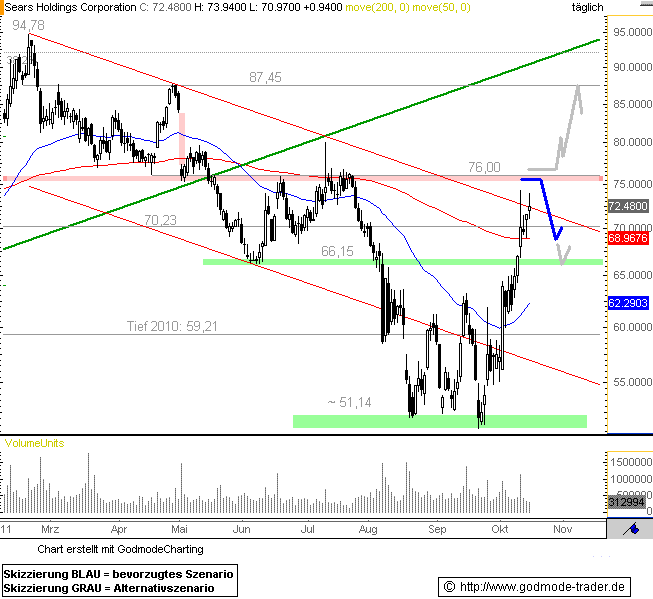 |
S | 10/18/11 | 75.00 | 10/19/11 | 76.00 | -1.32% | 1 | BoGo |
IBM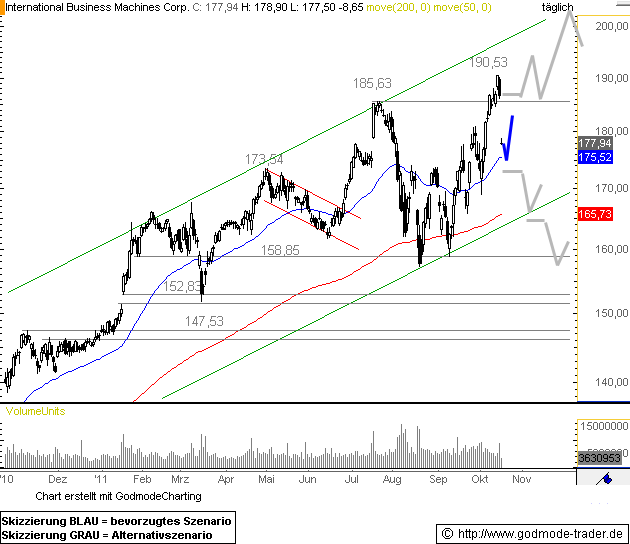 |
L | 10/18/11 | 177.94 | 10/27/11 | 185.63 | 4.32% | 9 | BoGo |
Last update: 4/12/2012 6:40:38 PM
To the Top Of Best Online Stock Trading Center
Do you find this content useful? Like! Tweet! Recommend! Share!
About the Best Online Stock Trading Signals Center
Currently all trading signals are provided by two sources, MPTrader.com (from U.S.) and Godmode-Trader.de (from Germany/Europe). Both sources are reliable with long tradition and many years of experience, so we think they deserve to be included. It has to be said, that all signals are driven from their free service, which is also available on their websites and via RSS feeds. Data provided by sources is not in exact the same format as we provide. We try to do our best to convert the written source text and charts into numbers, which can be faster to read and easier to track. We do the customization on our own and is provided as is, based on our private opinion, for which we disclaim any and all warranties, whether express or implied, including (without limitation) any implied warranties of merchantability or fitness for a particular purpose.
To get the whole picture of a trading idea, you should check the source article provided. Only this way you will fully understand author trading idea and act accordingly. You must understand that technical analysis is of subjective nature; if one sees one picture on the chart, someone else might see there something else. Two people might trade the same chart differently because of this fact. Never forget that! If there is another trusty provider of technical analysis trading ideas out there on the web, you can suggest it for inclusion.
All you readers are very welcomed to post your comments about signals provided and the best online stock trading center in general. If you like what you see, share, tweet, and like it. Hopefully you will be returning to this site often, so make sure to bookmark it as well.
To the Top Of Best Online Stock Trading Center
Written by: Goran Dolenc
Related Articles

Where to Invest Money Secret Revealed
Would you like to know where to invest money? Find hot tips, short and long-term investing and trading ideas.

Stock Market Events - Calendar of Global Stock Market Events and Fairs
You can find different stock market events, financial fairs, trading expos, and other types of joining investor's community from all over the world on this site.
Back from Best Online Stock Trading to Where to Invest Money
Back from Best Online Stock Trading to Best Online Trading Site for Beginners Home Page


