VIX Volatility Index - Is High VIX Value Suggesting the Bull Market is Over?
CBOE VIX Volatility Index is a measure of investors fear, measuring expected volatility of S&P 500 index options and is an interesting indicator of where the market is going.
VIX is the ticker symbol for the Chicago Board Options Exchange Volatility Index, a popular measure of the implied (market's expected) volatility of S&P 500 index options over the next 30 day period.
It is not backed by anything and positions held are merely a prediction of a future. Although the VIX is often called the "fear index", a high VIX is not necessarily bearish for stocks. Instead, the VIX is a measure of fear of volatility in either direction, including to the upside. VIX was introduced in 1993.
Calculation of VIX
The VIX is calculated and disseminated in real-time by the Chicago Board Options Exchange. It is constructed using the implied volatilities of a wide range of S&P 500 index options. This volatility is meant to be forward looking and is calculated from both call and put options. Higher (or lower) volatility of the underlying security makes an option more (or less) valuable, since there is a greater (or smaller) probability that the option will expire in the money (i.e. with a market value above zero). So a higher option price implies greater volatility, other things being equal.
Understanding VIX
In theory, high VIX readings mean investors see significant risk that the market will move sharply, whether downward or upward. The highest VIX readings occur when investors anticipate that huge moves in either direction are likely. Only when investors perceive neither significant downside risk nor significant upside potential, the VIX will be low.
In practical terms, when investors anticipate large upside volatility, they are unwilling to sell upside "call" stock options unless they receive a large premium. Option buyers will be willing to pay such high premiums only if similarly anticipating a large upside move. The resulting aggregate of increases in upside stock option "call" prices raises the VIX.
On the other side, when the market is believed as likely to soar as to plummet, writing any option that will cost the writer in the event of a sudden large move in either direction may look equally risky. Aggregate growth in downside stock "put" option premiums occurs when option buyers and sellers anticipate a likely sharp move to the downside.
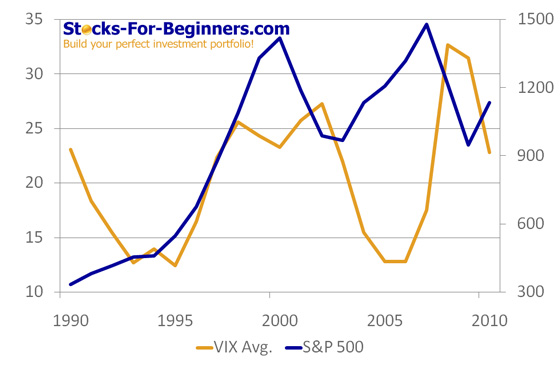
Volatility index is negatively correlated with S&P 500 Index, as it can be seen from the chart below.

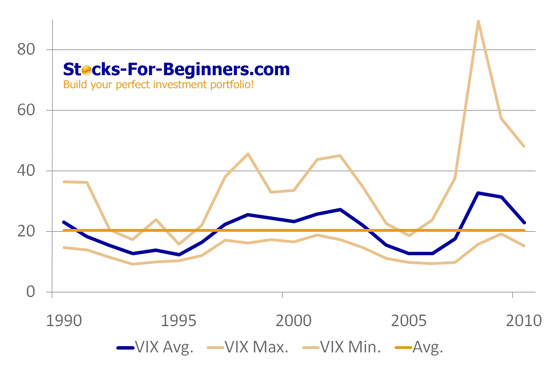
VIX volatility index values greater than 30 are generally associated with a large amount of volatility as a result of investor fear or uncertainty, while values below 20 generally correspond to less stressful, even complacent, times in the markets. Long-term average value of VIX is 20.41. VIX is certainly an interesting indicator to help you get a sense of where the market is going.

VIX Volatility Index Real-Time Chart
The VIX volatility index reached all-time high during the last financial crisis in October 2008, when index reached intraday level of 89.53 points. The latest minimal value of the index was reached in April 2010, when index fell 83% to 15.23 points.
For interactive chart please visit StockCharts.com.
Investing in VIX
Since 2006 the VIX volatility index itself became directly investable. You can buy or sell VIX contracts, it also has an active futures market as well as an Exchange Traded Notes that seeks to track its performance.
- VIX futures contracts began trading in 2004.
- Exchange-Listed VIX options began trading in 2006.
- VIX futures based Exchange Traded Notes (ETNs) launched by Barclays iPath began trading in 2009: iPath S&P 500 VIX Short-Term Futures (VXX) and iPath S&P 500 VIX Mid-Term Futures (VXZ).
Written by: Goran Dolenc
Do you find this content useful? Like! Tweet! Recommend! Share!
Back from Volatility Index to Investing in Stock Market
Back from Volatility Index to Best Online Trading Site for Beginners home page


