Understanding the Stock Market - How Stocks, Bonds, Commodities and US Dollar Relate?
Understanding the stock market in terms of how four major financial markets (stocks, bonds, commodities and US Dollar) affect each other in the long run is crucial for success.
You have probably heard for John Murphy, an expert for intermarket analysis, who is studying long term relationships between stocks, bonds, commodities and US Dollar. Few days ago John has published an article about this topic on StockCharts.com and we found it so informative, we have decided to make a summary and present in to our readers as well.
Normal Market's Relationships
As John has written in his book Intermarket Analysis: Profiting from Global Market Relationships, there are 'Normal' and 'Unhealthy' relationships between this four major financial markets.
Normal relationships are:
- Stocks move in the INVERSE* direction as Bonds
- Stocks move in the INVERSE direction as Commodities
- Stocks move in the SAME direction as US Dollar
- Bonds move in the INVERSE direction as Commodities
- Bonds move in the SAME direction as US Dollar
- Commodities move in the INVERSE direction as US Dollar
* Remark: What is very interesting is the correlation between stocks and bonds. Before 1998, the correlation between these two financial markets was positive; stocks have generally moved in the same direction as bond prices: if bonds prices were rising (lower bond yields), also stock prices were rising. After 1998 this relationship has somehow changed and the major reason is Asian currency crisis and fear of global deflation. The new relationship between stocks and bonds lasted throughout the last decade. As you can see, understanding the stock market is not something that is fixed; stock markets are alive and requires you to keep learning to understand them.
If we put it in other words, if the markets are in good shape and everything is working normally, than stocks and US Dollar should be raising and falling together for example, while bonds and commodities should be trading in opposite direction at the same time. If this is the case, there is very high probability that current market trend will continue; if this is not the case and some of the relationships are broken down, you can expect changes in some of the market's directions in the future.
Intermarket Relationships Chart
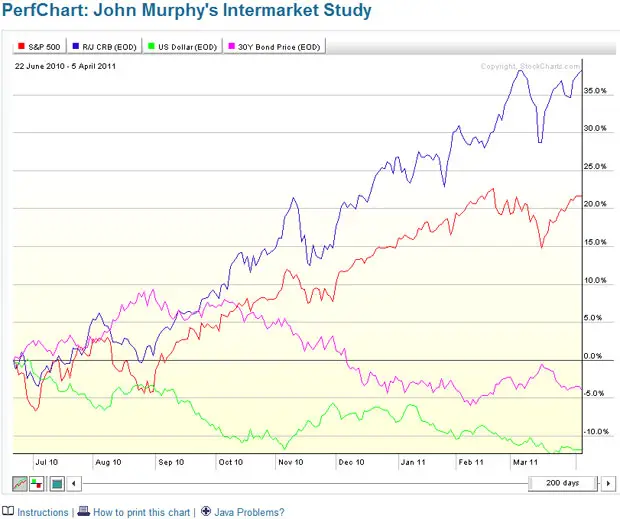
At StockCharts.com you can find the Intermarket Performance Chart, which is the best place to follow current trends in the four mentioned financial markets: stocks ($SPX), commodities ($CRB), bonds ($USB), and US Dollar ($USD).
Current Situation On the Market's
If we take a look at the current Intermarket Performance Chart and try to determine current trends in major financial markets - understanding the stock market, we can see that stocks and commodities are raising, bonds are also raising since February 2011, and US Dollar is falling. We could describe current situation as:
- Stocks vs. Bonds: Unhealthy
- Stocks vs. Commodities: Unhealthy
- Stocks vs.US Dollar: Unhealthy
- Bonds vs.Commodities: Unhealthy
- Bonds vs.US Dollar: Unhealthy
- Commodities vs.US Dollar: Normal
So, looking at the last few months, almost nothing is normal on the financial markets. We currently have many unhealthy relationships on the markets and therefore we can expect some changes in the future. What this intermarket analysis itself doesn't answer you is when will the change happen (could be tomorrow or it could take months) and it also doesn't tell you which market will change direction (for example, we know that stocks and commodities should not move in the same direction; now, to establish normal market conditions, one of these two markets will have to change its direction; will it be stocks or commodities?).
Written by: Goran Dolenc
Do you find this content useful? Like! Tweet! Recommend! Share!
Back from Understanding the Stock Market to Stock Market Basics
Back from Understanding the Stock Market to Best Online Trading Site for Beginners home page


