Silver Investing - Historical Analysis of Silver Spot Price Movement
Interested in silver investing? Here you can find historical analysis of silver price movement compared to gold.
Silver investing requires you to follow the silver prices regularly. Silver is trading on commodities market and like any other investment, you must be aware of silver prices trend, since it can tell you a lot about what is happening on other markets (stocks, bonds, currencies ...); always think of inter-market analysis.
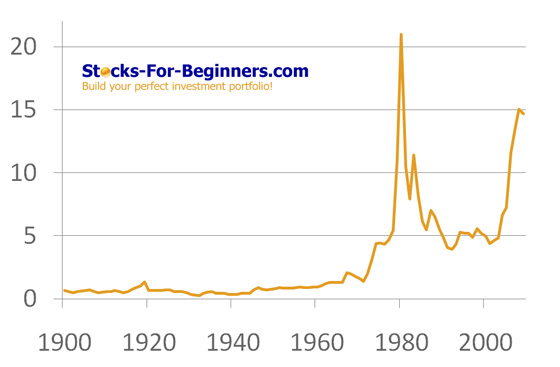
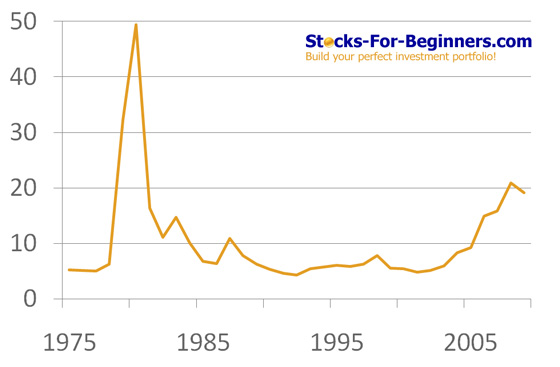
Silver prices today (06-02-2010) are not even close to historical nominal maximum, which happened in January 1980, when silver prices rose to $49.45 an ounce.
Silver Yearly Average Nominal Prices
London FIX, 1900-2010

Historical maximum of silver is connected with brothers Hunt, who attempted to corner the world silver markets in the late 1970s and early 1980s, at one stage holding the rights to more than half of the world's deliverable silver (other than that held by governments). During Hunt's accumulation of silver prices rose from $11 an ounce in September 1979 to nearly $50 an ounce in January 1980.
Silver Yearly High Nominal Prices
London FIX, 1975-2010

But on January 7 1980 (known as Silver Thursday), in response to the Hunt's accumulation, the exchange rules regarding leverage were changed, when Comex adopted 'Silver Rule 7' placing heavy restrictions on the purchase of commodities on margin. The Hunt brothers had borrowed heavily to finance their purchases, and as the price began to fall again, dropping over 50% in just four days, they were unable to meet their obligations, causing panic in the markets. The price of silver collapsed to below $11 an ounce two months later, much of the fall on a single day.
Silver Investing - Gold/Silver Ratio
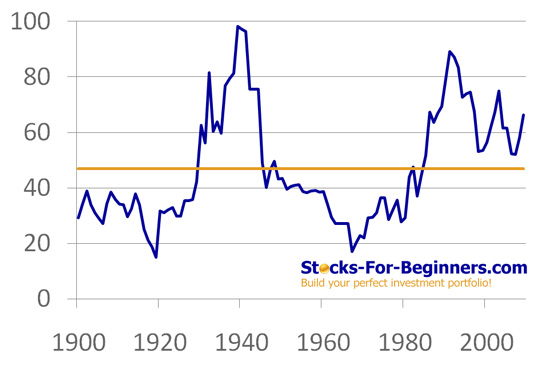
When we take the gold and divide it by the price of silver we get an analysis tool called the Gold/Silver Ratio, which is comparing the markets directly and we can see which market is outperforming the other market. When the blue line heads higher, gold is performing better, when the blue line heads lower, silver is performing better. In the short term this may not be so clear, but in the long term it can describe a very clear story.
Silver Investing - Gold/Silver Relative Ratio
1900-2010, Historical Average Is 47, Historical Support Is 30

Average historical Gold/Silver ratio is 46.94 (110 years, from 1900 to 2010). This means that based on historical average it takes 47 ounces of silver to buy one ounce of gold. At the moment (06-02-2010) currently Gold/Silver ratio is 66.33, which is well above historical average and we can conclude, that silver is very undervalued comparing to gold according to this ratio. If the ratio gets close to 47 at today gold prices, the silver price should be around $26.00 ($1,220 / 47), presenting more than 40% growth potential for silver comparing to gold. If the gold/silver ratio will touch long-term support at $30, the growth potential for silver is even higher.
Silver Investing - Price Forecast
In recent years, gold and silver have outperformed equities and real estate. Due to the very bullish fundamentals, this trend is likely to continue in the coming years, especially because of the increasing global macroeconomic, currency and geopolitical risks, silver historic role as money and a store of value, the ever declining and very small remaining silver deposits, dwindling supplies, significant industrial demand and significant and growing investment demand. By clicking the following link, you will proceede to short and intermedium term price forecas for Silver ETF (SLV).
Written by: Goran Dolenc
Do you find this content useful? Like! Tweet! Recommend! Share!
Back from Silver Investing to Commodities Market
Back from Silver Investing to Best Online Trading Site for Beginners home page


