Fibonacci Sequence - Trading Fibonacci Numbers Like Professionals
Fibonacci sequence can be a very powerful tool or even the basis of a standalone trading strategy for investors and traders in bull or bear market and any time frame.
The Fibonacci sequence is the series of numbers 1, 1, 2, 3, 5, 8, 13, 21, 34, 55, 89, 144, 233, 377, 610 ... introduced by mathematician Leonardo Pisano (nickname Fibonacci), born in 1170 in Italy. Fibonacci sequence starts with 1, 1 and afterwards Fibonacci numbers are constructed in a way, that every next number is the sum of the proceeding two: 2 (1+1), 3 (2+1), 5 (3+2), 8 (5+3), 13 (8+5), 21 (13+8), 34 (21+13), 55 (34+21), 89 (55+34), 144 (89+55), 233 (144+89), 377 (233+144), 610 (377+233) etc.
Beside Fibonacci sequence there are the Fibonacci ratios. By comparing the relationship between each number, and each alternate number, and even each number to the one four places to the right, we arrive at some fairly consistent ratios.
For example:
- If you divide any number to the next higher number on the right, you always get 0.618 (34/55=0.618).
- If you divide any number to the second higher number on the right, you always get 0.382 (34/89=0.382).
- If you divide any number to the third higher number on the right, you always get 0.236 (34/144=0.236).
- If you divide any number to the next lower number on the left, you always get 1.618 (55/4=1.618).
- If you divide any number to the second lower number on the left, you always get 2.619 (89/34= 2.619).
- If you divide any number to the third lower number on the left, you always get 4.235 (144/34= 4.235).
- And so on...
The most important Fibonacci ratios are 0.236, 0.382, 0.618, 1.618, 2.618, 4.236, less important are 0.764, 1.382, and for good measure we include 0.50 and 1.00; 0.618 and 1.618 are often referred as golden ratios.
Since this simple series of numbers and ratios are describing the natural proportions of things in the universe, they are prevalent in nature all around us. Fibonacci numbers appear in ancient buildings, in plants, planets, molecules, the dimensions of human bodies, and of course snails... But of what use is all that to stock trader or investor?
Use Of Fibonacci Sequence In Technical Analysis
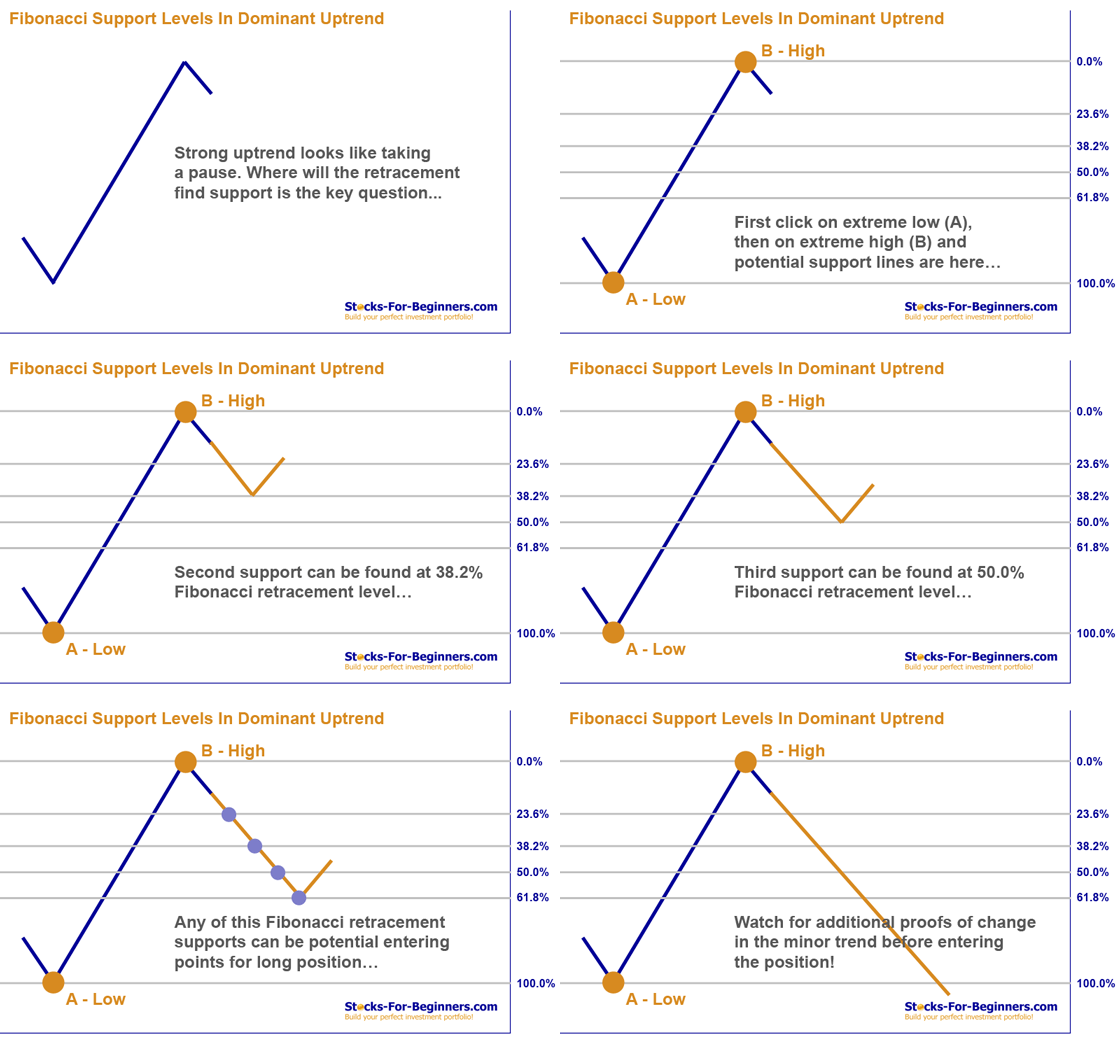
What really interests you is the application of Fibonacci sequence in the trading environment. Fibonacci analysis is part of technical analysis (chart analysis) that can be very useful tool for identifying support and resistance levels or determining profit targets for any time frame and any asset class like stocks, ETFs, futures, forex. As long as you are dealing with liquid instrument, the price of the security will "very often" retrace and advance in Fibonacci proportions almost to the penny. Let's confirm that by analyzing some charts.
Factors To Consider Before You Begin Using Fibonacci In Trading
In real world of trading and investing you will not calculate all the Fibonacci levels and draw the lines on the chart by hand. Instead, you should get yourself a good enough technical analysis software, which will offer you precise use of Fibonacci retracement and Fibonacci extension tools. The tool you will use must be simple enough and should offer you easy changing of time frames, fast symbol changing and plotting other technical indicators on the chart.
You will soon find out that using technical analysis tool for drawing Fibonacci retracements by selecting two extreme points on a chart is very easy, but determining extreme low and high is the major problem of Fibonacci analysis. People look at charts differently and so will have their own version of where the extreme high and extreme low points should be. Therefore it is more recommended that you use Fibonacci sequence in combination with other fundamental or technical analysis tools and indicators, even though it can be also used as standalone tool on which your stock trading strategy is based.
Yeah, one more thing. It can happen that you will find a stock that is absolutely ignoring Fibonacci sequence levels; in this case this trading strategy can't work, no matter how you like it.
How To Apply Fibonacci Sequence To Your Stock Trading Strategy
There are unlimited options of how to use Fibonacci sequence in trading or investing. I will cover one of the most wanted strategies, determining entrance and exit points together with risk management in uptrend. Similar (just the way around) strategy can be developed for downtrend. The presented strategy can be used in any time frame and with any instrument, according with your trading style and trading plan.
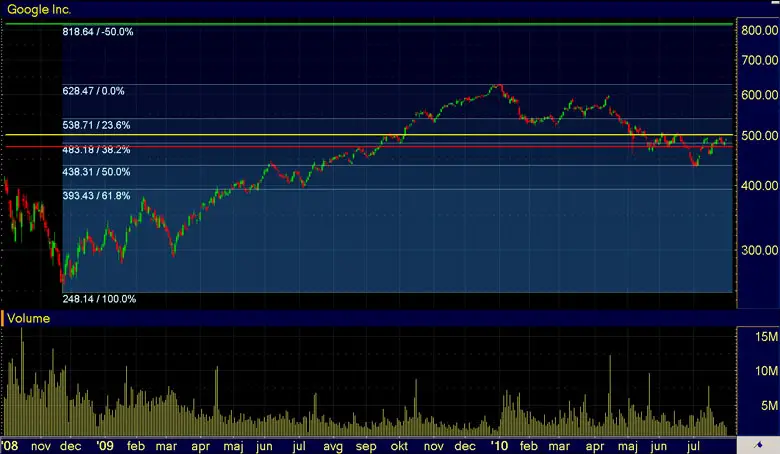
We have used Google stock as an example, daily chart from low in 11-21-2008 at $247.30 to high 01-04-2010 at $629.51. Google stock is in an uptrend since end of 2008. Of course if you would look at only 2010, than Google stock is in downtrend, but this is not our trading time frame. Last quote on 08-03-2010 was $490.41.
Plot Your Chart In Tradable Time Frame
Run you charting software and plot your favorite stock chart in the time frame, you usually trade. For example, if you are medium-term investor, use a daily or weekly chart for last few years. If you are swing trader, use daily chart for last 6 months and so on.
Plot Fibonacci Levels With Fibonacci Retracement Tool
Use Fibonacci retracement tool to draw the Fibonacci support and resistance lines on the chart. Click on the low candle and move your mouse to the high candle or however you software requires you to do it.
Determine The Trend
Trend is defined by your trading time frame and this is quite easy thing to do. Look at the chart, if the stock price is moving from bottom left corner to the upper right corner, than you have an uptrend. Most of the time you will be looking for stocks to be in uptrend or downtrend and react in the same direction of trend; other strategies are also possible, but let's keep it simple at this point.
Determine The Entrance Level
Ok, so far we have a stock in an uptrend, which is in a correction lately. Perfect, that is exactly what we are looking for if we would like to enter the stock. Where should we enter? Anywhere around Fibonacci levels. The most preferred entrance point is at 61.8% retracement level, but it can be also earlier. Some Fibonacci traders enter the position at every Fibonacci level, starting slow, with small volumes at 23.6% and then adding up the volume at every next level.
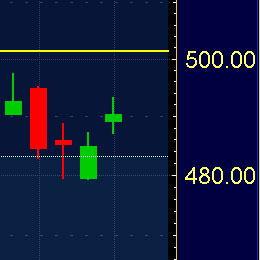
In our concrete example of Google stock, we have already missed some entrance points in the retracement phase of the stock. I am not sorry for 23.6% entrance point, but I am sorry for being too late to enter Google stock at 50% retracement level. At the moment the stock is trading around 38.2% level and this could be also a good entry point. To enter the stock more confidently I will wait for the stock to pass the last high few days ago at $497.50 - I will put a stop buy order even a little bit higher, at $501 - yellow line (I want the stock to pass the psychological price at $500; just below round numbers there are often many selling limit orders and I am looking for the buyers with enough power to move the stock to the next Fibonacci level). If Google stock will go down before it will reach our entry level, no problem. Be patient, like I said, even better entry level is at 50% or 61.8% retracement level. Below 61.8% the trend is not your friend anymore and you can stop thinking of buying Google stock for a while.
Determine The Stop Level
No technical study is perfect; we warn you all the time about this fact. That is why you have to protect yourself in case you were wrong, in case the stock will go opposite direction to what you have expected. I suggest you to place the stop order just below the last low around the Fibonacci level of you entrance point. There are different methods of how much below last low you should set you stop; some use tight stops while other don't like to get out of the trade to soon. I prefer to watch the stock chart, to tell me the story.
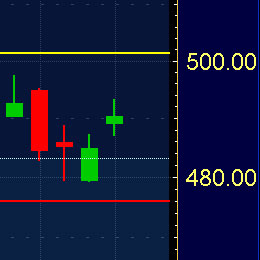
In our concrete example of Google stock, we have placed an stop buy order at $501, which is around 38.2% retracement from our time frame high. The last low around this level was $479.14 on 07-30-2010. If you will look at Google stock chart history, you will notice, that if the stock passes the low, it will continue to fall further (it almost never passes the low for a few pennies and then turns back up again). This is telling me that I can afford a tight stop in this case. I will use 0.5% stop below last low at $476.74 (red line).
Determine The Exit Level
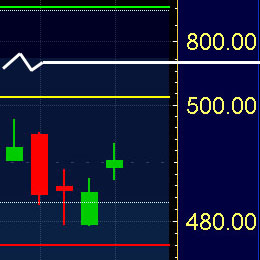
The last thing to determine is profit target. Well, you have probably heard of wording "let your profits run while cutting loses". That is why profit target is determined more as a level, where we will be more focused on what is happening with the stock, if there are any signs of trend reversal, rather than use it strictly as exit level. Generally you can expect the stock to extend the movement in the direction of the trend to the amount that is equal to the retracement of the stock in correction phase, but you should pay special attention to the stock movement at every single Fibonacci level. If there are sufficient signs of bulls losing their power and there is high possibility that trend will change, you better exit the position, otherwise let the profits run. One often used method is also to exit part of the position on every higher Fibonacci level, adding the exit volume on every higher level (just opposite to entering the position).
In our concrete example of Google stock, if 50% retracement will be confirmed as the last low in medium term uptrend, than we can expect the stock price to rise 50% above the Fibonacci high; our exit target is therefore at $818.64 (green line). But pay also close attention at 23.6% level ($538) and 0% level ($628) for any signs of trend change.
Recommended Reading - Recommended Reading - Recommended Reading - Recommended Reading
Fibonacci Sequence Trading Conclusion
That is how to use Fibonacci sequence in trading purposes. It helps you determine entrance and exit levels based on support and resistance. Using the strategy as explained above, you are totally controlling the risk, which is the most important thing. Remember, you can make money as long as you don't lose it.
Google Case: In our concrete example of Google stock we have determined entry level at $501, stop at $476.74 and exit level at $818.64. Your risk per share is $24.26. If you have a $100,000 trading account and according to your trading plan your maximum loss per position is 1%, than you can afford to lose all together $1,000 on Google position; your position size would therefore be 41 shares (1,000/24.26). On the other side you have a great medium term profit potential of $317.64 per share, giving you reward- risk ratio of more than 13 (317.64/24.26).
Written by: Goran Dolenc
Do you find this content useful? Like! Tweet! Recommend! Share!
Back from Fibonacci Sequence to Stock Market Trade
Back from Fibonacci Sequence to Best Online Trading Site for Beginners home page


