Current Gold Prices - Is Gold At All Time High?
First look at current gold prices is suggesting us, that gold at all-time nominal highs is probably expensive at these levels. But is this really the case?
First look at current gold prices is suggesting us, that gold at all time nominal highs is probably expensive at these levels. But is this really the case? Adjusting historical gold prices with inflation is giving us some interesting starting points in determining whether current gold prices are high, low or fairly priced.
In times of uncertainty investors turn to gold as a hedge against unforeseen disasters since gold is one of the few investments that is not simultaneously an asset and someone else's liability. But how successful is gold as inflation hedge?
What Is Inflation And What Is Inflation Hedge?
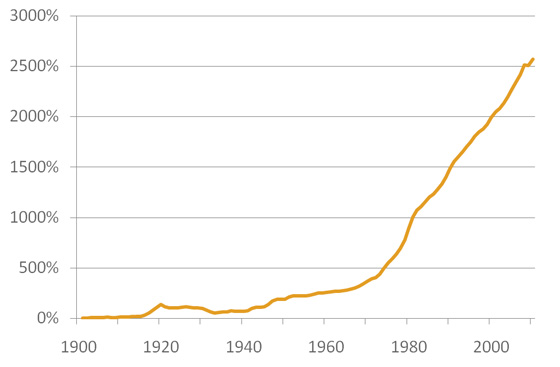
US Cumulative Inflation 1900-2010

While reading financial literature, you will often read that gold is inflation hedge. Let's first clear out, what exactly is inflation hedge. Inflation hedge is an investment designed to protect against inflation risk, therefore its value will typically increase with inflation. And what is inflation? Inflation is defined as a sustained increase in the general level of prices for goods and services. As inflation rises, every dollar you own buys a smaller percentage of a good or service.
Inflation Over Last 110 Years
Average yearly inflation rate in the last 110 years period, from 1900 to 2010, was 3.11%. In 89 years out of 110, there was positive inflation, meaning, the prices of goods and services did rise; only in 14 years, there was negative inflation, also called deflation, when prices of goods and services actually dropped. The longest period in this 110 years history with deflation was between 1927 and 1933, lasting 7 years; in all other times, deflation normally appears only for 1 year. The last deflation year was 2009 and before that 1955; deflation year are obviously very rare. What is also interesting in 110 years cumulative inflation was 2,568%. Take inflation seriously, since it is strongly lowering your real returns.
Historical Gold Prices
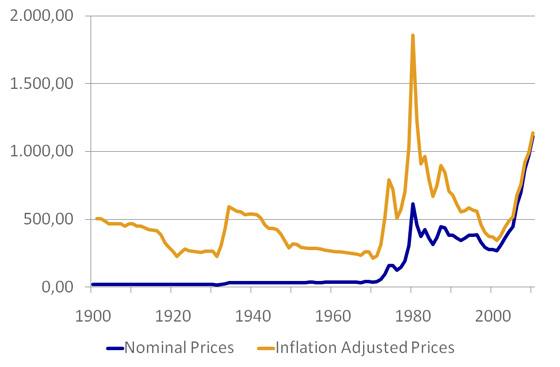
Inflation Adjusted Avg. Annual Gold Prices,
In April 2010 Dollars, 1900-2010

Average yearly gold price growth in the last 110 years period, from 1900 to 2010, was 4.91%. In 58 years out of 110, gold prices rose and in 38 years gold prices dropped. The longest and strongest decade of gold price growth was between 1971 and 1980, when gold prices grew more than 370% cumulatively. Another strong decade for gold is actually still not finished; it started in 2001 and gold prices grew cumulatively 154% till 2010. The last growth period for gold, which ended in 1980, was followed by 20 years of declining gold prices; almost every year the price of gold felt. Will it happen again, will the history repeat itself and will the decade of gold prices growth be followed by another 20 years of declining gold price?
Adjusting Nominal Gold Prices With Inflation Factor
Looking at the gold chart, where nominal prices are plotted, it is clear that gold has never in history been as high as it currently is. But what if we adjust the prices with inflation? We can do that very easily. If you understand, that $1 today will be worth less after one year because of inflation, that you also understand, that the same $1 was worth more one year ago than it is today because of the same reason. One year ago you could afford to buy more stuff for $1,000 than you are able to today. We calculated all the inflation back from 2010 to 1900 and adjusted (build-up) nominal gold prices with this cumulative compounded factor, to get historical gold prices presented in current US dollar value.
Gold As Inflation Hedge?
It's a very interesting picture we get. Suddenly we see that current gold prices at around $1,200 level are in real-terms not historically highest levels. In year 1980 gold was actually trading at around 1,800 dollars per ounce, representing historical maximum. Difference between historical maximum and current gold prices is 50%, which could present more room for growth of gold prices.
Obviously we can conclude that on the long-term gold is not doing a good job as inflation hedge; gold prices are not catching up with inflation!
Gold In Real Terms
In real terms, analyzing inflation adjusted gold prices, average yearly gold price growth in the last 110 years period, from 1900 to 2010, was only 1.69%. Only in 39 years of 110, gold actually had positive return; the strongest decades were 1970 to 1980 and 2001 to 2010 (not finished yet). In all other years, growth of gold prices was negative or not high enough to cover the inflation.
Written by: Goran Dolenc
Do you find this content useful? Like! Tweet! Recommend! Share!
Back from Current Gold Prices to Commodities Market
Back from Current Gold Prices to Best Online Trading Site for Beginners home page


