Elliott Wave Theory - Predict Stock Markets Moves
The Elliott Wave theory assumes that crowd psychology moves from optimism to pessimism in predictive waves. Improve your trading results by recognizing them.
The Elliott Wave theory is a form of technical analysis that investors use to forecast trends in the financial markets by identifying repetitive cycles which arise from extremes in investor psychology. Author of this investment strategy is Ralph Nelson Elliott; the concept was developed in the 1930s.
One of the most advanced users of this trading technique today is Robert Prechter, who has made some accurate forecasts using the theory, particularly the crash of 1987; but Prechter's record at the end of the twentieth century has not been so perfect.
The Elliott Wave Theory
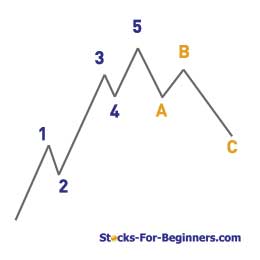
The Elliott Wave theory assumes that crowd psychology moves from optimism to pessimism and back again in a natural sequence, which can be predicted. These swings create patterns in the price movements of a market at every degree of trend.
Elliott's model says that market prices alternate between five waves and three waves at all degrees of trend. Within the dominant trend, waves 1, 3, and 5 are impulse waves, while waves 2 and 4 are corrective waves. In a bull market the dominant trend is upward - five waves up and three down, while in a bear market the dominant trend is downward, so the pattern is reversed - five waves down and three up. Impulse waves always move with the trend, while corrective waves move against it.
Each smaller wave can be further broken down into more waves, which are interrelated by Fibonacci numbers (1, 1, 2, 3, 5, 8, 13, 21, 34, etc.), and on it goes.
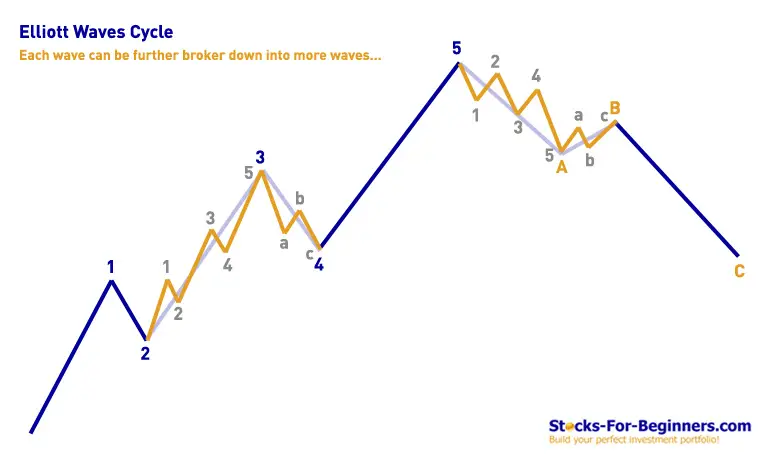
Elliott Waves Characteristics
Each of waves has its own characteristics, which typically reflects the psychology of the moment. Understanding those personalities is the key to the application of the Wave theory. Let's first look at the five waves in the dominant trend of a bull market (apply in reverse in bear markets):
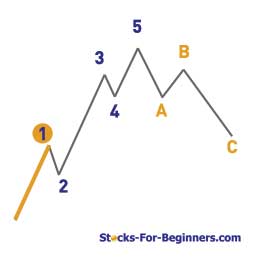
Elliott Wave Theory - Wave 1
When the first wave of a new bull market begins, the fundamental news is almost universally negative. The previous trend is considered still strongly in force. Fundamental analysts continue to revise their earnings estimates lower; the economy probably does not look strong. Sentiment surveys are decidedly bearish; put options are in vogue, and implied volatility in the options market is high. Volume might increase a bit as prices rise, but not by enough to alert many technical analysts.
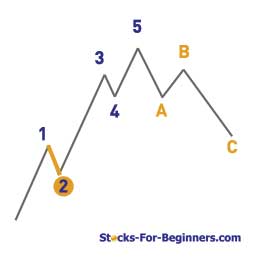
Elliott Wave Theory - Wave 2
Wave two corrects wave one, but can never extend beyond the starting point of wave one. Typically, the news is still bad. As prices retest the prior low, bearish sentiment quickly builds, and "the crowd" haughtily reminds all that the bear market is still deeply ensconced. Still, some positive signs appear for those who are looking: volume should be lower during wave two than during wave one, prices usually do not retrace more than 61.8% of the wave one gains, and prices should fall in a three wave pattern.
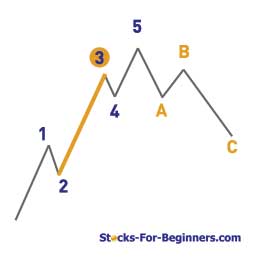
Elliott Wave Theory - Wave 3
Wave three is usually the largest and most powerful wave in a trend. As wave three starts, the news is probably still bearish, and most market players remain negative. But by wave three's midpoint, the news will become positive, fundamental analysts start to raise earnings estimates and "the crowd" will often join the new bullish trend. Prices rise quickly, corrections are short-lived and shallow. Anyone looking to "get in on a pullback" will likely miss the boat. Wave three often extends wave one by 161.8%.
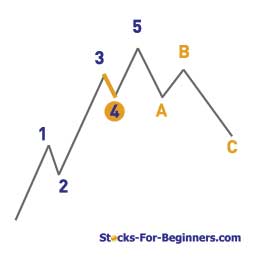
Elliott Wave Theory - Wave 4
Wave four is typically clearly corrective. Prices may meander sideways for an extended period, and wave four typically retraces less than 38.2% of wave three. Volume is well below than that of wave three. This is a good place to buy a pull back if you understand the potential ahead for wave 5. Still, fourth waves are often frustrating because of their lack of progress in the larger trend.
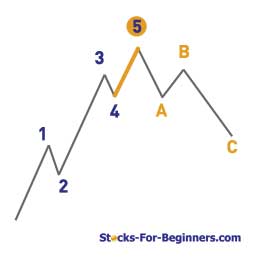
Elliott Wave Theory - Wave 5
Wave five is the final leg in the direction of the dominant trend. The news is almost universally positive and everyone is bullish. Unfortunately, this is when many average investors finally buy in, right before the top. Volume is often lower in wave five than in wave three, and many momentum indicators start to show divergences: prices reach a new high but the indicators do not reach a new peak.
Corrections are typically harder to identify than impulse moves. Let's look at the three waves in the corrective trend of a bull market (apply in reverse in bear markets):
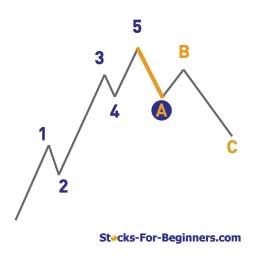
Elliott Wave Theory - Wave A
In wave A the fundamental news is usually still positive. Most analysts see the drop as a correction in a still-active bull market. Some technical indicators that accompany wave A include increased volume, rising implied volatility in the options markets and possibly a turn higher in open interest in related futures markets.
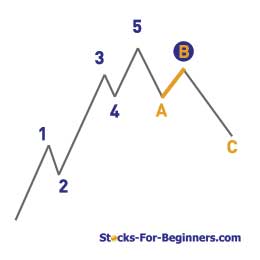
Elliott Wave Theory - Wave B
Prices reverse higher, which many see as a resumption of the now long-gone bull market. Those familiar with classical technical analysis may see the peak as the right shoulder of a head and shoulders reversal pattern. The volume during wave B should be lower than in wave A. By this point, fundamentals are probably no longer improving, but they most likely have not yet turned negative.
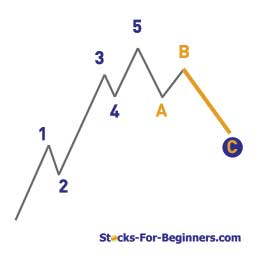
Elliott Wave Theory - Wave C
Prices move impulsively lower in five waves. Volume picks up, and by the third leg of wave C, almost everyone realizes that a bear market is firmly entrenched. Wave C is typically at least as large as wave A and often extends to 1.618 times wave A or beyond.
Wave Duration
Wave analysis runs the gamut from super-cycles lasting hundreds of years to sub-minuets that may last only a few minutes on an intraday chart:
- Grand supercycle: multi-century
- Supercycle: multi-decade (about 40-70 years)
- Cycle: one year to several years (or even several decades under an Elliott Extension)
- Primary: a few months to a couple of years
- Intermediate: weeks to months
- Minor: weeks
- Minute: days
- Minuette: hours
- Subminuette: minutes
Elliott Trading Strategy
The major waves determine the major trend of the market, and minor waves determine minor trends. Elliott provided numerous variations on the main wave, and placed particular importance on the golden mean, 0.618, as a significant percentage for retracement.
Here is an example of an Elliott cycle for Apple stock (AAPL) between 2004 and 2009.
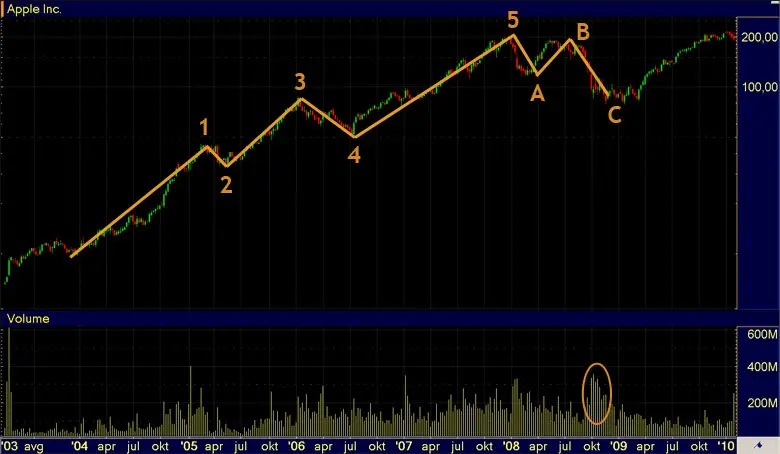
Elliott theory works best in indices and equities with high liquidity and move according to key forces of fear and greed on the part of many participants! When a security is not prone to this crowd behavior and is controlled instead by a few strong hands, Elliott patterns begin to break down and are therefore more difficult to forecast.
Elliott Trading Strategy General Rules And Guidelines
- Carefully watch evolution of wave 2, which should never retrace more than 100% (ideally not more than 66%).
- Enter wave 3 in the direction of the trend. Wave 3 cannot be the shortest of the three impulse waves; noramlly wave 3 or 5 are the longest waves.
- Stay out of market during wave 4; wave 4 does not overlap with the price territory of wave 1.
- Enter wave 5; with commodities this is often the longest wave.
- If you are aggressive investor with higher risk-tolerance you can take countertrend ABC at top of wave 5; have in mind, that waves 2 and 4 will often take alternate forms - a sharp move in wave 2 will suggest a mild move in wave 4 and vice versa.
Elliott Trading Strategy And Risk Management
The major problem with trading Elliott concepts is the highly subjective aspect of the theory into finding the correct counts. Elliott practitioners can spend days arguing over correct wave count but, in many cases, the number will not be confirmed until after the fact.
Example Of Wrong Counting Elliott Waves
If the trader mistook the bottom of wave 2 to be the bottom of wave 4 and entered a long trade, he or she would catch wave 3 instead of wave 5 and still make a good profit because both waves 3 and 5 are generally powerful up moves. But if the same trader mistook wave B for wave 1, and then entered a long trade at the next pause because he or she thought it was a new wave 3; this pause would've actually been a continuation of wave C, making the trade a painful experience, especially if wave C was incomplete.
Therefore it is crucial that you implement clear risk management strategies when your trading is based on Elliott Waves - you should use tight stops and define realistic profit targets; losses must be kept small and profits must be allowed to accumulate. This way it won't really matter if you will count the waves wrong; you can still be very profitable as long as you can determine the primary direction of the trend and differentiate between the primary and corrective waves.
Recommended Reading - Recommended Reading - Recommended Reading - Recommended Reading
Trading Elliott Waves With Computer Programs
Computer programs (like Refined Elliott Trader for example) have helped take the subjectivity out of the Elliott Wave theory. Intense statistical analysis of wave reliability has proven mathematically that the theory is based on sound principles of market behavior. Using the computer program and its powerful pattern recognition engine may dramatically impact your trading results, however, still demands a thorough understanding of Elliott Wave patterns.
Written by: Goran Dolenc
Do you find this content useful? Like! Tweet! Recommend! Share!
Back from Elliott Wave Theory to Stock Market Trade
Back from Elliott Wave Theory to Best Online Trading Site for Beginners home page


